2018 PdM survey results: More outsourced maintenance and monitoring
It has been more than 18 months since the last Plant Services survey on predictive maintenance – a stretch of time during which manufacturing has seen a resurgence in the United States, with 17 of the 18 major industries in growth mode, according to the Institute for Supply Management. Interest in the IoT and cloud-based technologies is sky-high and, at 3.7%, unemployment is way low.
The results of this year’s PdM survey reflect the optimism in our industry. We’re able now to look back across five years of data, thanks to your continued interest and input into this research project. Although much of the data indicated only slight differences from 2017, several new insights emerged that had not been observed across previous years – specifically, increased outsourcing and servitization of predictive maintenance activities, and fewer perceived obstacles to PdM program success.
The full set of 2018 survey data are available at http://plnt.sv/1810-PDM. Read on for survey highlights, and come back in November for additional analysis from several leading industry experts.
Servitization and outsourcing
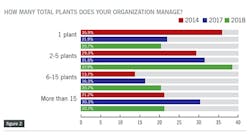
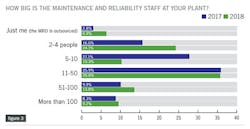
The first big surprise in the survey data came within responses to the first three questions, which are designed to establish a basic demographic profile of respondents. Figures 1, 2, and 3 chart out the primary job function of this year’s respondents, the number of plants their organization manages, and the size of the maintenance and reliability staff.
When it comes to reported job titles, we observed a moderate rise in the number of reliability engineers, maintenance technicians, and controls engineers; in fact, since 2014, the number of people in these roles has in each survey. Also of note, the reduction in the number of plant managers seems to have halted in 2018, after a significant drop from 2014-2017. It’s more difficult to identify patterns in the data on number of plants managed, aside from a trend in the rise of companies that manage 2-5 plants.
However, the data in Figure 3 (the size of maintenance and reliability teams) point to a very interesting trend: a significant rise in the level of outsourced MRO. After staying relatively stable from 2016 to 2017, the share of people reporting that they fully outsource this function jumped by nearly 150% from 2017 (2.8%) to 2018 (6.9%).
The rest of the data from Figure 3 indicate that the middle ground is shrinking on whether to outsource work in this area, as the numbers of both smaller (2-4 people) and larger (51-100 people) teams increased, and the number of teams in the middle fell, especially teams of 5-10 people. One possible explanation for this trend is that plants used the industry momentum of the past year to either add to their teams or seek out maintenance/reliability partners external to the organization.
Data from Figures 4 and 5 help put these data in context. When asked if they are using OEM-enabled remote monitoring technologies or services (see Figure 4), respondents indicated an increase in their current use of these services and forecast an increase in use within the next three years; there also was a drop in the share of those who reported they have no plans to engage with partners outside the organization.
Figure 5 illustrates the frequency with which survey respondents share their PdM data, and with which types of teams they share. Plant teams seem increasingly willing to share their data on a quarterly basis with partners outside the plant, and that the share of respondents who would “never” totally outsource PdM work is dropping.
Taken together, these data reflect an increased interest in the servitization of PdM work and an increased opportunity for third parties to partner with industrial organizations to deliver these services. This trend also aligns with the general challenge in our industry to bridge the skills gaps left by retirements in a period of low unemployment: If full-time talent is difficult to find, then it makes sense to explore which partners might be available to drive PdM program success.
Holding your programs together
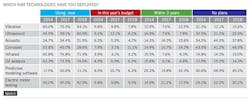
At the heart of the Plant Services PdM survey are the questions on which technologies respondents are using and how satisfied they are with their PdM programs. Figure 6 provides the data on the first question, with many of the responses holding steady from 2017 to 2018. After several years of having three PdM technologies (infrared, vibration, and oil analysis) achieve a reported use rate of 70% or higher, this year saw vibration analysis fall back to 64.1%. Also, ultrasound continued its gradual rise in use, breaking through into the 60s this year with a reported use rate of 60.9%.
Beyond the big four, no other technology achieved a use rate higher than electric motor testing did at 42.9%. Predictive modeling software dropped to a meager 11.1% use rate, with almost 50% of respondents saying they had no plans to consider using predictive modeling.
Although 2018 survey data on use of various technologies didn’t deliver major surprises, it did confirm that PdM technologies (and by extension, proactive maintenance approaches) are stable and mature. The benefits of predictive maintenance are familiar and widely known, both financial and operational, and PdM programs enjoy more executive support than ever.
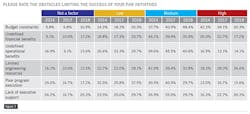
A quick glance at the data in Figure 7 reinforces the sense that confidence in PdM programs is high. The perception among respondents that an obstacle was either “high” or “medium” dropped nearly across the board, and “low” or “not a factor” increased in all but one area. This is a startling result, striking in its consistency, especially since it was only two years ago that plant teams reported having significant difficulty articulating the financial and operational benefits of their programs. Also, in the area of program execution, the share of respondents indicating this as a high or medium challenge dropped from 57.6% in 2017 to 45.3% this year.
The data on overall PdM program satisfaction, as reported in Figure 8, suggest slightly reduced levels of satisfaction this year as compared with 2017. However, the share of respondents who defined their programs as “satisfactory” remained virtually unchanged, indicating confidence in PdM’s ability to generate benefits.
Reactive or proactive? And, how proactive?
The final data set we’ll consider deals with maintenance approaches that respondents report using and the extent to which respondents are applying internet-enabled and mobile technologies to conduct predictive work.
Figures 9, 10, and 11 feature respondents’ answers about the approaches they take to reactive and proactive maintenance. The data in Figure 9 are encouraging in that the share of survey respondents engaged with proactive maintenance (69.8%) isn’t drastically behind the share engaged in planned and/or reactive maintenance (84.1% and 81.0%, respectively).
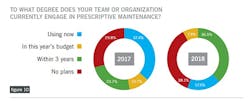
The survey also asked a few questions on respondents’ experience with prescriptive maintenance (often abbreviated “RxM”), in which data is assimilated from diverse process and performance variables and then woven into actionable recommendations (or “prescriptions”) on what to do, when to do it, and how. Prescriptive maintenance is closely associated with internet of things (IoT) technology and is a useful index to assess whether organizations are moving down a path that would involve partial or full digital transformation of plant operations.
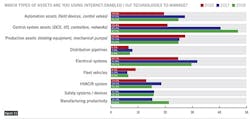
Figures 9 and 10 indicate that from 11.1% to 17.5% of respondents are currently engaged in prescriptive maintenance, whether at the pilot or full project level, and 36.5% more are planning on prescriptive maintenance work within three years. Figure 11 provides context to these data by reporting on the types of assets that respondents say they are using IoT technologies to manage. It’s no surprise to see control system assets way out in front of all other options (47.2%), followed by electrical systems (29.2%), production assets (25.0%), and automation assets (25%).
The surprise result in this area is that respondents indicated a slight reduction in the use of IoT technologies across most asset categories; there was no significant drop in use reported, but significant increases were reported in only three asset classes: control system assets, manufacturing productivity, and fleet. These results, combined with the general confidence that plant teams are reporting in their ability to overcome obstacles, suggest that organizations are locating value in these three specific asset classes for their digital maintenance projects.
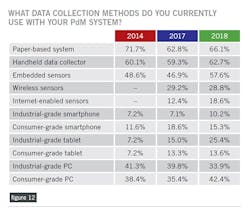
The final set of data included in this article is from what has become my favorite question on the survey: What data collection methods do you currently use with your PdM system? Figure 12 lists results from all four surveys, and once again, paper-based systems (66.1%) are at the top of the list, rebounding upward this year after a gradual three-year decline.
The data points that caught my attention were significant jumps from 2017 to this year in the use of embedded sensors, internet-enabled sensors, and industrial-grade tablets. Taken together, this data cluster suggests that condition-monitoring data are increasingly being collected and analyzed in real time, and that organizations are becoming much more comfortable (even reliant) on mobile devices and networks to successfully execute their maintenance strategy.
Several further articles are in development based on additional data from the 2018 PdM survey, and will take deeper dives into the areas of training and motors analysis. In the meantime, please consider downloading the full set of 2018 survey data (available at http://plnt.sv/1810-PDM) and sharing your thoughts with us on what you see in the data.


