How to use CMMS data for reliability analysis
The basics
In this article, we use a case study example to discuss the benefits of a detailed, routine reliability analysis. We review the process, methodology, and results of the study to illustrate the benefit of the analysis. In this case study, a routine analysis was completed remotely by a small and experienced team of reliability specialists in four calendar weeks. Some key parameters for the site include:
- total maintenance spend of ~$120M per year
- asset count of ~100,000
- annual work order (WO) count of ~50,000
- corrective (unplanned) spend of ~80%.
Work order costs and counts, as well as corrective versus proactive costs and asset counts, are easily determined using standard CMMS transaction codes (t-codes). Most sites have the data to support this type of analysis.
From the first report, we can determine several KPIs to be used for benchmarking across units and sites, including Maintenance Cost Index (MCI) and Corrective Maintenance (CM) Cost.
While this level of analysis does not require significant data, it also does not provide significant value. To dive deeper into where costs have historically gone, particularly unplanned costs, we need to associate WO data to the functional locations (FLOCs) and master data in the CMMS as a way to ultimately impact the site’s reliability in the future. For many sites, this is already stored in the CMMS. For others, this will require a manual exercise—mapping FLOCs to equipment categories based on one of many data fields in the CMMS. Standard categories are easy enough to define, and most equipment can be covered in just a handful of common categories. In our example, most of the 100,000 assets could be categorized in less than four hours.
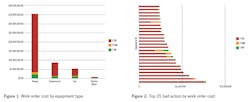
The result of such an exercise allows us to see more precisely where historical costs have been allocated. In our case study, we find that much of the corrective costs have been booked to just a few equipment categories (i.e., pumps). This view of WO data starts to enlighten us on where our corrective costs have been spent on-site. However, since all readily available FLOCs were mapped to equipment categories, this can be expanded further to identify the top bad actors by maintenance spend. Based on findings from Figures 1 and 2, one can then prioritize site-level reliability improvement efforts toward proactive maintenance on pumps.
While value-added, this still only focuses on historical costs of the equipment. So, how can we expand the analysis to enhance what only one system can tell us?
Advanced analysis for justification of reliability initiatives
A reliability analysis very quickly begins to add additional insights when previously disconnected systems can be correlated. By prioritizing areas of focus, an engineer can dive into equipment specifics to narrow down reliability initiatives. Using CMMS data, we cover two different advanced reliability analysis techniques and the benefits they provide to asset management reliability.
Failure Mode Identification from CMMS WO Data. The equipment category mapping and bad actor identification discussed above provide high overview trends and KPIs across the site. Picking one asset, by FLOC, to examine in greater detail will often facilitate the identification of failure modes as a way to target maintenance spend effectively via reliability initiatives. From the same case study introduced earlier, a three-pump system was selected as a candidate for further analysis as a bad actor. The following was identified from the WO data from the CMMS for the three-pump system:
- Total maintenance of ~$400,000 across the three pumps in about five years
- 120 monthly PMs for motor air filter replacement / cleaning
- three motor failures with an MTBR of about 22 months
- CM spend per event about $75,000.
For this system, an in-depth review of all WO failure descriptions showed that the pump motor has been failing due to rotor misalignment. When linking this with motor bearing replacements and high temperature readings in the remaining CM WOs, a reliability engineer can deduce that repeated motor failures are due to a lack of magnetic center verification during installation. With this information, the site is then able to assess the implementation of precision maintenance procedures during replacement as method of increasing the low MTBF of the system.
Additionally, based on WO data, the existing proactive tasks to replace the air filters in the CMMS do not adequately target all applicable failure modes. The other failure modes can be targeted for condition monitoring and the existing PMs can be updated to more accurately identify pending motor failure conditions (i.e., high vibrations due to improper motor magnetic center). Findings on an equipment-specific deep dive, such as this pump system, often provide and justify reliability improvements for similar assets across the site. The precision practices implemented here will help to extend the MTBF of any newly installed electric motor on-site.
Life Cycle Cost to Justify Reliability Initiatives. The roadblock to most reliability initiatives comes through cost justification. In the previous section, adding precision maintenance, vibration rounds, and lubrication rounds have an added maintenance cost to the organization. A powerful tool that can be incorporated as part of a reliability analysis is building a life cycle cost (LCC) around an asset using WO data from the CMMS. For the same pump system from the previous section, an LCC was modeled using different reliability implementation initiatives, targeting the discussed failure modes, to select the most cost-effective maintenance strategies.
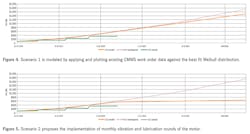
As shown in Figure 3, the cumulative cost of owning and maintaining the pump system has increased since the installation date of the asset and it will continue to grow into the yellow region of the graph. Ultimately, the goal of the LCC is to develop the most cost-effective maintenance initiatives through the entire life of the asset. Given what is known from the CMMS WO data, an engineer can model different reliability scenarios and propose the most cost-effective strategy to site management:
Scenario 1 - LCC of the pump system as-is (monthly task to replace air filters
- Task Interval, monthly (from CMMS)
- Task cost $200 (from CMMS)
- Task effectiveness, 5%
Scenario 2 - LCC of the pump system with vibration/lubrication rounds (PdM)
- Task interval, monthly
- Task cost, $1,000
- Task effectiveness, 35%
Scenario 3 - LCC of the pump system with precision maintenance implementation and vibration/lubrication rounds (PdM)
- Task interval, 5 years/monthly
- Task cost, implementing into procedures/$1,000
- Task effectiveness, 80%
Scenario 1 is modelled by applying and plotting existing CMMS WO data against the best fit Weibull distribution, here an infant mortality failure pattern as shown in Figure 4 with the close trajectory of the green and red-dotted/yellow lines. The graph shows the LCC of the asset, with the existing proactive tasks as-is, projecting cost into the future past the point of available WO data. It is evident that the existing proactive task is ineffective in addressing the root cause of the failure.
Scenario 1 is the real scenario observed in the case study based on the WO data, in which case a concerned engineer should then flag this and propose a second scenario to improve system reliability. For Scenario 2, the engineer proposes the implementation of monthly vibration and lubrication rounds of the motor. This task does not change the failure pattern observed, which assumes improper motor installation as seen on WO data, but it is more effective in predicting when failures will happen. In Figure 5, the LCC of implementing this new initiative shows a greater reduction of CM spend on the asset as the task is more effective.
Scenarios 1 and 2 are two examples where the LCC of the asset can be projected by correlating the existing CMMS WO data to a best fit Weibull distribution. Now let us look at a third scenario without the use of the WO data to match a failure pattern, but rather using the identified failure modes from the WO details discussed in the previous section to model an LCC in the presence of an effective task. Per the reviewed WO data descriptions, the motor in the pump system needs magnetic center verification during installation. Given the low MTBR of the motor and high-temperature bearing failure, it is clear to an engineer that the root cause is attributed to a lack of magnetic center verification. In such cases, the task in this scenario would be to update existing maintenance procedures for the inclusion of precision with a step to verify magnetic center of the motor, and performing condition monitoring via vibration and lubrication rounds.
Here, the LCC is modeled with a fatigue failure pattern (expected for a properly installed motor) in the Weibull distribution. With proper installation the motor has an expected life of 60 months versus current MTBR of 22 months, resulting in a much lower LCC as depicted in Figure 6.
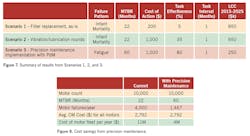
With a 10-year LCC, the benefit of proper installation of the motor is $600,000 in savings when compared to the current approach. The results of the three scenarios can be summarized in Figure 7. As such, the engineer and the maintenance organization can start the implementation of updating procedures for the inclusion of precision maintenance and condition monitoring with vibration and lubrication rounds, not just in the motors observed in this case study but rather to the entire fleet of similar critical assets.
Though simple to complete, an LCC is often not feasible to be performed for all 100,000 assets, which is why it is important to understand bad actors from a reliability analysis first, in order to flag those candidates that have the greatest benefit potential from a well-defined LCC. Based on the analysis performed as part of this case study, an engineer can then assume that if the same proactive and precision maintenance tasks are added to other similar assets across the site, the overall CM spend will go down drastically. If we have a motor asset count of 10,000 and apply the same life extension benefit from an MTBR of 22 months to 60 months with the implementation of precision, then the cost savings would be $7M per year, as shown in the results in Figure 8.
Reliability roadmap
The results of a comprehensive reliability data analysis should be used to build and support the reliability improvement roadmap. These results prioritize which equipment should be addressed and which levers will provide the greatest and most immediate benefit.
Some of the goals of a reliability data analysis are identifying trends and opportunities and quantifying the benefits of a reliability initiative. This includes:
- evaluating and trending maintenance costs by category and type, which sets the basis for trends and prioritization of improvement opportunities
- quantifying equipment category costs, MTBF, and bad actor candidates, which highlights specific focus areas for improvement efforts, as depicted in the LCC approach.
Using basic data and simple digital tools, a reliability engineer can effectively enhance a site’s asset management approach. A computerized analysis does not replace personnel knowledge that can be used to develop and come up with the right failure mode and assumptions to match the right statistical model; they complement each other.
This story originally appeared in the November 2021 issue of Plant Services. Subscribe to Plant Services here.
Massimiliano Giffuni is a maintenance and reliability engineering specialist at T.A. Cook with more than five years of asset management as a practitioner in the petrochemical industry. He has served as a fixed equipment engineer at one of the nation’s largest petrochemical facilities, supporting multiple units with responsibilities ranging from day-to-day reliability activities to STO planning and execution.
Colemann O’Malley is a manager at T.A. Cook with extensive experience in asset management, risk assessment, and implementation of reliability projects in the oil & gas industry. As an electrical engineer with several years of field experience in refining and chemicals, he is piloting the implementation and development of digital solutions in asset management.


