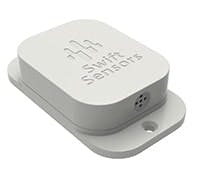
Swift Sensors adds predictive maintenance tools to its Manufacturing Analytics Dashboard
Swift Sensors announced its new predictive maintenance tools for its Manufacturing Analytics Dashboard. The new tools add trend analytics to key manufacturing metrics of compliance, utilization, maximum, minimum and average measured values monitored by the wireless sensor system. Eleven new dashboard panels have been added for measuring analytic trends across multiple shifts.
With the new dashboard panels, a trend line is calculated using the best fit line algorithm for the measurement data across each shift. The slope of the trend line represents the trend per shift, which indicates the overall tendency of the analytics value to increase or decrease by a specific amount from one shift to the next.
The trend analytics include a confidence percentage to indicate how well the trend line correlates with the historical data. A high confidence level indicates the trend is more likely to continue. Conversely, a low confidence level indicates the trend is not a reliable predictor of future values because the historical data is too chaotic.
Learn more about Swift Sensors' predictive maintenance tools


