Baseline and monitor efficiency of compressed air systems
There have been many excellent articles written about ways to reduce compressed air operating costs. This often is achieved by beginning an awareness campaign and assigning a person the responsibility of justifying, implementing and verifying the improvements. Perhaps you, or someone you know, has taken up this challenge. Fixing leaks, reducing potentially inappropriate uses, adding more air receivers, reducing pressures, optimizing control strategies and recovering heat are good strategies and worthy of consideration. However, in these times of limited resources, choosing the best options within the available budget is important.
Air is free, right?
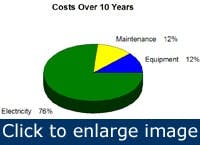
Figure 1. The cost structure for the first 10 years of an air compressor’s use can surprise many executives. (Compressed Air Challenge)
Most companies don’t know what it costs to operate their air compressors, nor can they assess the cost of using 10, 50 or 100 cubic feet per minute. Many are surprised to discover that the operating costs throughout the life of compressed air equipment greatly exceed the initial purchase price (Figure 1). In fact, in most cases, the annual energy cost alone will exceed the purchase price in the first year of operation. It’s essential to determine the current annual costs in dollars and communicate this to all involved. In this way, better decisions can be made on new equipment selection and mode of operation of existing equipment.
If you want to cut costs, realize that compressed air:
- Isn’t the most efficient source of energy in a plant
- Often is the biggest end use of a plant’s electricity
- Is frequently used inappropriately
- Should be viewed as a system that can be managed
- Has costs that can be measured
A good management axiom is, “If you can’t measure it, you can’t manage it.” If the plant is monitoring the power and tracking the total compressor energy consumption, management’s first step is much easier. However, where do you start if your plant doesn’t monitor and measure the input power (kW) and output cfm?
Get with the plan
The Compressed Air Challenge (CAC) has developed a seven-step action plan that is the centerpiece of its popular Fundamentals of Compressed Air training program. Plant personnel can use the steps in this action plan to better understand the system and what it costs to operate. This can help focus on areas of potential improvement that lead to reduced costs. Successful plan implementation also should ensure that any savings from successful improvements are communicated to management to pave the way for the funding that additional future projects will require.
A complete discussion of the Seven Step Action Plan is beyond the scope of this article and is best left to the participants in any given Fundamentals course. You can visit the Compressed Air Challenge website for more information.
Where are you now?
A key element in the plan is the need to baseline your system by taking measurements that quantify the effectiveness or efficiency of the compressed air system as it is before modification. The baseline figures establish where you are now in terms of system efficiency, cost, reliability and other measurements. It’s used for comparison purposes against which the performance of an improved system can be evaluated and reported to management. Measurements of power, energy, pressure, leak load, flow and temperature normally are required to best establish the baseline, and are taken before and after making changes.
Improving system efficiency and increasing the output (cfm) for every unit of input power (kW) is what characterizes a successful outcome. Prove that your improvement efforts work by reporting them by using terms that can be converted to dollars saved. This is the language that upper management understands and often is a key to determining your ultimate success.
It’s a system
Improving and maintaining peak compressed air system performance requires not only addressing individual components, but also analyzing both the supply and demand sides of the system and how they interact. This practice often is referred to as taking a “systems approach,” because the focus is shifted away from individual components to total system performance.
On the supply side, an important step in developing awareness of the compressed air system operation is to calculate what it costs to produce the compressed air. This exercise can be very simple or extremely complex, depending on the size of the air system and the accuracy of the desired result. Measuring and recording kW is, by far, the most preferred method to determine input power. However, if there isn’t any metering, it’s possible to approximate the annual energy cost using a standard formula and a clamp-on ammeter/voltmeter.
A calculation, taught to CAC Fundamentals course participants for a three-phase system, can be used to develop an estimate of annual electrical operating costs:
Operating cost = (FLA x LLV x 1.732 x pf x H x R)/1,000
Where:
- [pullquote]FLA = full-load amps = measured average of current in each phase
- LLV = line-to-line voltage = measured average of voltage in each phase
- PF = power factor (0.85 for 1,800 rpm motors, but verify this with motor manufacturer)
- H = annual operating time (hours)
- R = electricity rate (from utility bill, in $/kWh)
- 1.732 is the factor used for three-phase systems to determine the total power.
Pushing the service factor
Many packaged rotary-screw air compressors use part of the motor service factor when operating at full load and are, therefore, operating above the nameplate horsepower. The total package power generally is higher than for other equipment of similar horsepower rating, such as fans or pumps. Consider the approximate annual energy cost to operate a 200-hp compressor at full capacity and pressure based on the readings below. The calculation for part-load operation would depend on the specific type of control the compressor uses.
Operating cost at full-load = (237 amps x 461 volts x 1.732 x 0.85 pf x 8,760 hrs x $0.10/kWh)/1,000 = $140,900
If this compressor supplies 1,000 cfm, the annual cost per cfm is approximately $141. Reducing consumption by 50 cfm offers the potential to reduce annual costs by $7,000.
If the actual energy rate was $0.08/kWh, the annual cost would be 80% of the previously calculated amount, or $112,720, and the cost per cfm is then $113. If the operating hours were reduced, the cost would be similarly reduced.
You can improve your estimates. Many types of reasonably-priced flow meters can be installed (even hot-tapped) into almost any piping system to measure and record air flow. Also, consider kilowatt meters as an important part of your basic instrumentation set. If you’re monitoring only kW (or amps), you can use the data to determine the change in input power and annual energy cost before and after any implemented improvement.
Analyze the demand side
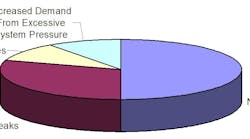
Figure 2. Only half of a typical compressor’s output goes into useful work.
Don’t overlook an analysis of the system’s demand side as it’s the main overall cost driver in producing compressed air (Figure 2). Some tips to consider in looking at your demand side for a new or existing system:
- List the air uses and their design cfm and pressure.
- Record the power before and after making any system changes.
- Benchmark and track overall leak levels. Most air leaks are very close to the end-use equipment.
- Understand the cost of leaks, identify and fix them, starting with the most significant.
- Install flow meters on the main supply lines and at specific end uses to facilitate calculating the compressed air cost for a given process or piece of equipment.
- Operate the system at the lowest possible pressure.
- Turn off the air to any idled equipment.
- Verify that compressed air is the best alternative for the application.
- Install gauges at various points in the main distribution piping to monitor pressure drops.
- Adjust controls after every change to optimize the savings.
Step by step
An actual case study submitted by one of the CAC instructors illustrates the usefulness of baselining. The system consisted of a lubricant-injected 1,000 cfm rotary-screw compressor with modulating control (intake throttling) requiring 220 bhp, driven by a 200-hp motor with an efficiency of 92% and a service factor of 1.15, operating 8,760 hours per year at a cost of $0.10 per kWh. (The plant’s actual energy rate for the last kWh consumed was less than $0.10). System air pressure was 80 psig, but the compressor could not keep up. The compressor discharge and plant system air pressure often was less than 75 psig, which caused production problems.
Improvements (Phase 1) included a larger receiver, pressure/flow controller, premium-efficiency motor, leak repairs and reducing inappropriate uses. The compressor controls remained as originally set. The original and new baselines are shown in the Table 1. Because of inefficient compressor controls, a reduction of 35% in compressed air flow only reduced the energy cost by 9% for an annual savings of $13,000.
Adjustments (Phase 2) included using a new, larger air receiver that permitted using a different control strategy (load/unload) on the compressor. With assistance from the local compressor supplier, the control was changed and the pressure settings adjusted to gain the benefit of the larger air receiver and the pressure/flow controller. These changes resulted in a more acceptable 17% reduction in energy of $24,400 per year. This was a marked improvement, but additional future savings were still possible.
Phase 3 proposes to retrofit the existing compressor with a variable speed drive and operate at 90 psig to allow for the pressure drop in air treatment equipment. This would result in an additional $18,400 savings compared to Phase 2 levels and a full 30% reduction in power relative to the original baseline, or $42,800 in annual utility cost reductions.
Baselining the project at each phase of the improvement plan makes it possible to track the progress and assess if it’s worthwhile to continue implementing further measures.
| Initial | Phase 1 | Phase 2 |
Phase 3 |
|
| Flow | 1,000 | 650 | 650 | 650 |
| Pressure | 80 | 85 | 85 | 85 |
| kW |
161 | 146 | 133 | 112 |
| kWh |
1,409,000 | 1,279,000 | 1,165,000 | 981,000 |
| $ Annual Cost | $140,900 | $127,900 | $116,500 | $98,100 |
| % Saved |
9% | 17% | 30% | |
Table 1: Sequential phases of an example project |
||||
This is an interesting example of how a plant went through the baselining steps, monitored the kW and calculated its savings. After analyzing the control operation, it became apparent that the most important step was to change the control strategy. There are many other similar case studies that resulted in hundreds of thousands of dollars in savings. The key is to maximize the savings on the supply side for each supply or demand side improvement.
Baselining is an excellent way to follow the dollar savings and report the facts to management to assist in making decisions on continuous improvements.
Bill Scales. P.E., is CEO of Scales Industrial Technologies and a CAC instructor for Fundamentals and Advanced Management of Compressed Air Systems. He’s the co-author of the 325-page manual, “Best Practices for Compressed Air Systems” and can be reached at [email protected] and (516) 248-9096 x 2611.
Ron Marshall, CET, CEM, is the industrial systems officer of Manitoba Hydro Customer Engineering Services in Winnipeg, Manitoba. Contact him at [email protected] and (204) 360-3658.
Both are members of the CAC Project Development Committee.


