Air Liquide Large Industries U.S. LP is part of Air Liquide Group, which produces industrial and medical gases and is headquartered in Paris. In the U.S., Air Liquide maintains more than 125 production facilities and 700 customer installations spread across some difficult to reach geographies. Before 2002, The U.S. company used a legacy vibration program that was inconsistent in its application of technology and wasnt producing the desired results.
Late in 2002, Air Liquide partnered with Rockwell Automation to provide vibration analysis services to 32 plants on a trial basis. The program expanded quickly in early 2003 to include vibration monitoring at 107 primary production facilities. In August 2004, Air Liquide recognized the need to expand its predictive maintenance (PdM) program to include oil and infrared analysis, and again partnered with Rockwell. Air Liquides needs and aggressive long-term strategy didnt leave time for incremental continuous improvement. The key program objectives included:
Transitioning from legacy systems to state-of-the-art information solutions
Understanding how reliability affects customer relationships and profitability
Recognizing the need for uniformity of predictive technologies
Leveraging technology in geographically challenging areas
Analyzing results and setting goals for improvement
Transitioning from legacy systems
Before 2000, maintenance and reliability functions were decentralized as was the responsibility for approximately 100 plant sites throughout the U.S. Since that time, Air Liquide in the U.S. has centralized these functions under a new maintenance department and regional reliability centers. The new department deployed several new systems including a maintenance management process, a new computerized maintenance management system (CMMS) and preventive maintenance programs. Once these basic systems were in place, the department turned its attention to its predictive maintenance programs.
Many of the sites used vibration, infrared and oil condition monitoring, but because no corporate standard existed for applying predictive technologies, individual managers had great discretion. As a result, applications were inconsistent and couldnt be integrated. Similar data was taken at different frequencies with different tools and at different locations for like equipment. Therefore, data and reports varied in format and detail, and information couldnt be compared and analyzed across similar equipment.
Because a company-wide CMMS didnt exist when these individual programs were established, predictive findings couldnt be linked to traceable work orders. Compliance of corrective actions versus predictive findings was unknown.
Several dozens of plants eventually coalesced around a common vibration service provider, but the program had several problems. The contractor owned the data it collected. While the contractor provided some standard reports, Air Liquide had to pay for ad hoc analysis it could have performed itself. But, more importantly, the contractor had only one office in the far southeast corner of the U.S. Given Air Liquides vast geography in the U.S., more than 80% of the costs the contractor charged were incurred for travel to the plant sites. Air Liquide knew there had to be a way to get greater value.
By 2001, the infrared scanning program was probably the closest to being national. Electrical standards had been developed and applied, and an internal resource was used for data collection and report writing. While the program was effective, it was used primarily for electrical devices and didnt include any applications to identify process, fixed equipment or rotating equipment problems. And given Air Liquides geographic dispersal and the travel it required, having a single resource dedicated to the program didnt seem viable in the long term.
Although it was implemented at several sites, oil condition monitoring was probably the least used of the technologies. There seemed to be significant potential benefits to increasing its use.
Customer relationships and profitability
Many of Air Liquides products are commodities. The company president once remarked, Winners and losers in our business are determined by those who can provide the most reliable product at the lowest possible price
and our maintenance and reliability programs have a huge effect on both success factors. Whether its nitrogen, oxygen, hydrogen, steam or electricity, customers want all of the product they want, when they want it, and they dont want to hear excuses why they cant have it.
This places a premium on our unit availability and equipment reliability. Not only must there be robust maintenance programs to ensure high reliability, but also a way to see problems far in advance so arrangements can be made for equipment downtime when customer demand is low. Thats why predictive maintenance programs play such a large role in Air Liquides reliability strategies, which play a significant role in its business strategy.
Before the 1990s, Air Liquide was primarily an air separation company that produced oxygen, liquid argon and both liquid and gaseous nitrogen. These air separation units could back up production to our largest gas customers by storing large quantities of liquid nitrogen and oxygen. We could then vaporize the liquid and sustain several days of downtime in the event of an interruption in service. The primary strategy for these products was to reduce our mean time to repair (MTTR). This meant focusing on stocking spare parts and having resources ready to react to get a unit running again before the liquid ran out.
Air Liquide also operates four large cogeneration units near Houston to provide electricity and steam to customers in the area. Because theres no effective way to store backup quantities of these products, Air Liquide adopted a conservative maintenance strategy that required significant costs and downtime to ensure predictable uptime.
In the late 1990s, Air Liquide expanded its business into hydrogen, a product that cant be stored easily in quantities needed to ride through any significant downtime. In this business, our standard air separation maintenance strategy didnt apply because even small trips caused huge problems for customers. Major breakdowns could be costly for both Air Liquide and its customers. For hydrogen, the conservative maintenance strategy we used for cogeneration required too much planned downtime to be feasible as a business strategy. The strategy had to provide interruption-free production with optimum downtime for planned maintenance.
In the meantime, a majority of our customers had already embarked on their own never-ending journey to reliability improvement. As they eliminated or improved their internal reliability problems, the reliability of their gas, steam and electricity suppliers gained greater visibility. As our customers improved their reliability game, they demanded more from suppliers. A world-class predictive maintenance program was becoming an important element of a critical reliability improvement strategy.
Unity of predictive technologies
Implementing a world-class, best-practice PdM program begins with identifying the required measurement variables and appropriate technology for capturing reliability data. For Air Liquide, the nature of the equipment monitored, predominant failure modes and mean time between failures necessitated using vibration, oil and thermographic technologies. Failure modes, MTBF data and industry best practices dictated a monthly interval for vibration data collection, quarterly for oil analysis, and annually for infrared thermography scans.
Before August 2004, the Air Liquide PdM program consisted of a decentralized approach to vibration monitoring, oil analysis and thermography. Neither a unified nor integrated approach was used in managing the data. Reports and recommendations werent linked to the CMMS or return on investment data.
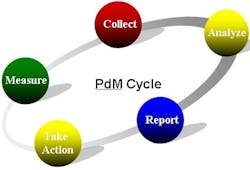
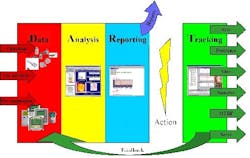
Improvements that started late in August 2004 have helped Air Liquide demonstrate a truly integrated and successful PdM program through the following steps (Figure 1):
Standardized reporting process and information flow
Centralized data storage and access through a common Web interface
Centralized PdM technologies, reports and analysis
Recommendations and reporting linked to CMMS data
An interface for live-time, closed-loop progress measurement
Standardizing the reporting process and information flow involved establishing a natural link between the reports and recommendations submitted for vibration, oil and thermography. This also included switching from oil and thermography programs run by individual plants to a single-source provider for the three technologies managed at the corporate level.
Rockwell Automation provided a common platform for integrating vibration and oil data, and partnered with Predictive Service Corp. to provide infrared thermography. A common reporting platform was established quickly and used as a report-generation tool. The latter feature was an application utility installed on each field service engineers personal computer.
Because infrared thermography was provided on an annual basis and generally only used for electrical components, this technology was linked via the Web interface only. Rotating equipment is added to the thermography scan when exceptions are noted in vibration and oil.
Centralizing the data storage into a common server platform enabled Air Liquide to leverage the CMMS database, PdM software database and information from the interface for reporting vibration, oil and thermographic scans. Once in place, a Web interface formed a dynamic link among the three data repositories, and measured and displayed program success.
Incorporating analysis data from each predictive technology ensures that asset health can be evaluated completely. Because each technology has a different monitoring interval, we ensured that oil samples were taken when field service engineers were taking vibration data.
When lab results are reported, oil condition data is added to the PdM database and incorporated into the overall recommendations made regarding asset health. Viscosity, wear particle analysis (WPA), analytical ferrography and other diagnostics are reported along with vibration data for complete machine condition status.
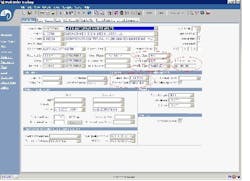
Since January 2005, we identified more than 148 cases of viscosity breakdown or improper lubrication. In at least five cases, WPA revealed significant particulate counts in conjunction with increased vibration measurements. Follow-up samples verify that proper lubrication was restored and machinery repairs have been made. A direct link to the recommendation and repair action taken enables these to be tracked and linked to PdM program performance (Figure 2).
Work class: PDM denotes any work order initiated as a direct result of a PdM program recommendation
Activity type: Denotes predictive technology used to identify problem using one of four tags: Predictive, Vib, Predictive, Oil, Predictive, IR or Predictive, Elec
Actual repair cost: Installation and repair cost of repair required
Estimated savings: The reliability engineers evaluation of problem reported and potential cost savings averted by avoiding catastrophic failure
Failure class: Type of machinery affected: motor, compressor, etc.
Problem code: Detailed definition of problem component; e.g., coupling failure
Developing the interface for monitoring real-time progress of maintenance work orders and PdM recommendations involved leveraging the existing CMMS database backbone and the centralized database storage architecture. Partnering with Predictive Services, Rockwell Automation designed and developed a Web interface capable of supplying a PdM Web management tool for tracking the closed-loop PdM process. The interface links, tracks and reports progress of any maintenance action initiated from the PdM program technologies (Figure 4). This tool enables senior management to track program KPIs, maintenance activity bottlenecks and overall program effectiveness quickly and efficiently.
Fundamentally, the PdM programs integration and unity established a direct link between maintenance repair recommendation and maintenance action taken. It permits measuring and tracking financial data, metrics and program success to provide ROI. Unless a direct correlation is established between maintenance action taken and recommended repair, program success cant be measured fully. An overwhelming majority of PdM programs fail because they lack this tie, and work orders and repairs are made without regard to the PdM recommendation.
Leveraging technology
Managing maintenance activities on a national level is a challenge many large organizations face. Geography and disparity of equipment implementation and plant design makes stocking of spares and planning maintenance activities difficult. Many OEMs, suppliers and key contractors have equipment in the field that will ultimately require maintenance.
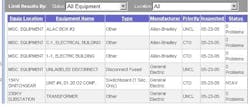
Implementing a system capable of tracking manufacturer type and reliability information simultaneously enabled Air Liquide to isolate problematic equipment manufacturers. This information can be used in supply-management negotiations and, more importantly, designing and engineering new plant construction. By leveraging the Web-based technology and interface, any reliability center manager, reliability engineer or maintenance technician can search and sort reliability problems by manufacturer type, equipment type or installed locations. We can do this at the plant level, by zone, business class or summarized for Air Liquide overall (Figure 5). Leveraging this data during contract negotiations can save Air Liquide a significant amount of time, money and effort.
Linking this interface to data in the CMMS database and PdM software database also enables better management of reported problems. Before visiting any Air Liquide facility, a preventive maintenance work order initiates data collection in the CMMS. Any recommended repair or follow-up work generated as a result of the PdM visit is then classified as a PdM work order type, linked to the PM work order and distinguished with the appropriate activity type and problem.
Because follow-up work orders are linked to the original PM visit, reports reveal if any follow-up work was completed. This enables better tracking of problems throughout the approval process, enables reliability engineers to budget appropriately and empowers the PdM engineer with the results of closing the loop.
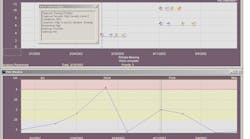
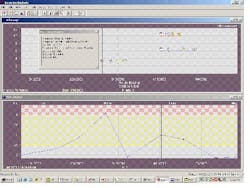
The bidirectional gateway and exchange of data between the PdM software database and the CMMS database is another example of leveraging technology to substantiate program success. Figure 6 shows a direct correlation between vibration data and work completed. The dynamic link enables up-to-date status information and the resultant cause/effect on newly acquired PdM data.
Analyzing results and setting goals
Aligning the PdM program vision statement with monthly tracking metrics (KPIs) establishes an overall indicator of the relationship among Rockwell Automation, Air Liquide and contract performance. KPIs are reviewed in the form of a monthly compliance report submitted to supply management and reviewed with the senior maintenance and reliability team. Because KPIs are reviewed monthly, PdM program success is tracked and recorded to justify program savings and ROI data. An example of the monthly compliance data and KPIs for Air Liquide include:
Sites visited
Samples taken
PdM saves
Warranty claims
Customer care issues
Program costs and payment information
Because each technology is a unique component of the overall PdM program, and work orders can be classified as such, further detail and tracking of individual PdM saves can be measured on a monthly and year-to-date basis. Figure 7 represents a breakdown of PdM activity by type for the period from August 2004 through August 2005 (one year of implementation).
MAXIMO | Work Orders |
Predictive, Vib | 267 |
| Predictive, Oil | 114 |
| Predictive, IR | 158 |
| Predictive, Elec | 89 |
| Total PdM W/Os | 628 |
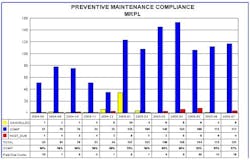
Also, we track and measure work order compliance to ensure the program derives actionable repairs from the PdM program recommendations. This variable is a measure of the number of new problems reported versus work orders initiated. Tracked by month, Figure 8 shows an example of one reliability zone.
Mark E. Lawrence, P.E., CMRP, is Director of Maintenance and Reliability at AirLiquide Large Industries U.S. LP in Houston, Texas. Contact him at [email protected] and (713) 624-8585. George F. Hofer is Corporate Program Manager at Rockwell Automation in Houston, Texas. Contact him at [email protected] and (713) 402-2288.
