Proper pump selection leads to efficiency, reliability, and profitability
Struggles with industrial production economics, a limited global energy supply and the realities of environmental conservation aren’t going to abate, so as energy costs rise, pump manufacturers are enhancing equipment efficiencies. Engineers have long known that matching the pump to system requirements is the way to achieve the highest level of pumping efficiency and equipment reliability. They know that applying a total-system-optimization approach to both existing and new pumping systems offers significant savings opportunities.
Understand the operating range
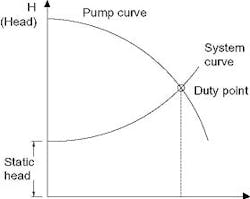
Figure 1. A rotodynamic pump operates at the point where the pump and system curves intersect – the duty point.
Effective energy reduction achieved through design and modification requires a thorough understanding of pump operating ranges. A pump curve is a graphical representation of the range of flows a rotodynamic pump can achieve. Likewise, a system curve graphically represents the flow characteristics of a given piping system. If the rotodynamic pump is installed in the system, their interaction also can be represented graphically (Figure 1). The x-axis is the volumetric flow rate and the y-axis is the head (pressure). The intersection of the pump curve and system curve is the duty point.
Notice that increasing the system pressure reduces the flow rate. At some point, increased pressure pushes the flow rate to zero, a condition to be avoided. To allow for unforeseen increased pressure demands, pumping system designers often select an oversized pump. The downside consequence of oversizing the pump is that it either produces excess flow or it needs to be throttled. Both conditions increase energy consumption and maintenance requirements while shortening pump life.
Measure specific energy
Specific energy is a useful metric for evaluating pump types, models and system configurations. It’s the power consumed per unit volume of fluid pumped. You calculate it by measuring the kilowatt-hours used during a test period and the fluid volume delivered into the system during the same test period.
Specific energy reflects the factors that influence both pump and installation efficiencies. It accounts for where on its curve the pump is operating when delivering flow into that particular system. Thus, it’s possible for a lower-efficiency pump to consume less power than a higher-efficiency pump, simply because of how well the pump’s characteristics mesh with a specific system configuration.
Process optimization is defined as identifying, understanding and eliminating unnecessary losses in a cost-effective manner while reducing energy consumption and improving pump system reliability. It’s the key to improving the performance of existing pumping systems, and begins by identifying system inefficiencies such as the following:
Symptoms of an inefficient pumping system
- Highly throttled flow control valve
- Bypass line (recirculation) to regulate flow
- Batch-type process in which one or more pumps operate continuously
- Continuous process with frequent pump on/off cycling
- Cavitation noise at the pump or in the system
- Parallel-pump configuration with the same number of pumps always operating
- Changed pump system function, but without hardware modification
- Inability to measure a pump system’s flow, pressure or power
Evaluate any pumping system that exhibits one or more of these symptoms. Give priority to any large, high-maintenance system that shows a symptom. Occasionally, your analysis will reveal that one or more pumping systems can be disabled without compromising the process.
The next system optimization step is measuring flow rate, pressure and power consumption using either installed process transmitters or portable instruments. Comparing the measured flow and head to the required flow and head might reveal a discrepancy, which can be indicative of an inefficient system. Comparing the current operating conditions to the design conditions also can reveal an improperly sized pump.
If the original pump performance curve is available, compare it to a curve representing the current system operating points. This can provide a general understanding of the current pump condition. Even a comparison of a single test point to the original curve can determine whether you should investigate the system further or merely overhaul a worn pump.
Minimize life cycle cost
Every rotodynamic pump has a sweet spot, its best efficiency point (BEP). A pump operating outside its acceptable operating range (even if reasonably close to its BEP) will be inefficient and exhibit higher energy use and shorter mean time between failures (MTBF).
Incorrectly sized valves can produce excessive pressure drops, and different valves can introduce different loss coefficients. If you use throttling valves or bypass lines to control flow, conduct an analysis to determine the most efficient means of flow control. Such variable-flow systems might benefit from some form of pump speed control, such as variable-speed drives.
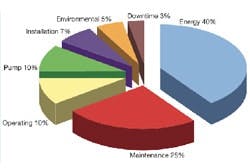
Figure 2. Energy dominates the life cycle cost for a typical pumping system.
The design and selection of new systems provide an opportunity to achieve minimum life cycle costs (LCC), including energy, maintenance and other costs. Significant life cycle opportunities flow from optimal pipe sizing (larger pipes deliver fluid with lower pressure drops), variable-speed drives, and rational pump and valve selection.
Pumping system operating points change over time. As systems age, corrosion, abrasion and solids buildup are likely to alter the effective pipe diameter. Cyclic mechanical and thermal loadings might cause piping fatigue damage. Valves, gaskets and other components are subjected to wear and corrosion. Worn or damaged impellers and other pump parts will affect system performance. These changes degrade the performance of the process control loop associated with the pumping system.
LCC analysis requires evaluating alternative system approaches. It’s quite common for the pump’s lifetime energy and maintenance costs to dominate its life cycle costs (Figure 2). Thus, it’s important to know the current cost of energy and to estimate future energy and maintenance costs. Other LCC inputs often can be estimated on the basis of historical data.
Seal losses add up
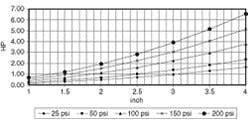
It’s especially important to realize how the power consumption associated with seals on smaller pumps can affect efficiencies (Figure 3). Brake horsepower requirements significantly increase when dual pressurized mechanical seals are used on pumps driven by low-horsepower motors at low speeds. Depending on the seal type and pump horsepower, the decrease in efficiency will vary from 0.5 to 10 points.
Figure 3. Power consumption of typical unbalanced seals, shown here at 3,550 rpm, can be significant for smaller pumps.
Face width and seal balances are application-specific and are functions of the seal type and its intended purpose. For instance, balanced seals designed for lubricating fluids might have a balance ratio of 75%, but custom-designed seals suitable for flashing hydrocarbons might need 80% or higher.
In addition, each mechanical seal consumes a certain amount of power that appears as seal-face heating. In most applications, for pressure differentials to 1,035 kPa (150 psi), speeds to 3,600 rpm and shaft diameters to 50 mm (2 in.), mechanical seal friction might represent a few hundred watts. The resulting heat can be dissipated to the turbulent fluid in the vicinity of the mechanical seal and by thermal conduction and convection to the adjacent pump parts and atmosphere.
Under more severe operating conditions, particularly with higher-pressure differentials, speeds and vapor pressure, frictional heating must be calculated more accurately and specific actions taken to dissipate it because it can cause the entire lubricating film between the seal faces to evaporate. Another important variable is heat soak, which results from the temperature difference between the seal chamber and its immediate environment.
Calculate the friction rate in the sealing gap of a liquid-lubricated seal using the following equation:
Pr = Pg x Ac x fc x Vg
Where:
Pr = friction rate in W (Btu/h)
Pg = sliding-surface pressure in N/cm2
Ac = sliding-surface area in mm2
fc = dynamic coefficient of friction
Vg = sliding speed in m/sec (ft/s)
Additional information about seal lubrication and power requirements are found in the Joint Hydraulic Institute and Fluid Sealing Association book, “Mechanical Seals for Pumps: Applications Guidelines,” which is available from the Hydraulic Institute (www.Pumps.org).
More thermal effects
A seal chamber temperature higher than that of the immediate environment leads to heat loss from the seal chamber. A lower seal-chamber temperature results in heat soak into the seal chamber. Major factors that affect heat transfer include thermal conductivity, seal chamber wall thickness and surface area, film coefficients on both sides of the seal chamber and temperature differences between the seal chamber and the surrounding environment.
The power the seal consumes or produces consists of heat soak, self-generated heat and turbulence. As a result, the heat load of the fluid within the seal chamber is represented as:
Total heat load = seal-generated heat + heat soak + turbulence (watts or Btu/hr)
Once the total head is known, calculate the flow rate required to remove the heat at a given maximum fluid temperature rise. Generally accepted guidelines are a temperature increase between 3°C to 9°C (5°F to 15°F).
Advantages of hot seals
The initial move toward high-temperature sealing systems was made for safety, longer seal life and reliability concerns. Users want seals that eliminate the danger of catastrophic failures if the environmental control systems fail. Recently, the economic advantages of running pump seals hot have been realized.
Research has revealed that an annual savings of $2,000 per 25 mm (1 in.) of shaft size can be realized for every 38°C (100°F) of cooling requirements that can be removed from the seal cavity. This cost savings comes from eliminating or reducing the energy expended to cool the mechanical seal.
Because most pump systems operate for 15 years or longer, initial cost represents a small portion of the expenditures needed to operate systems throughout their life cycles. Therefore, assuming responsibility for optimum design and operational efficiency are in your best interest. Because new pumping systems can be designed with cost-reduction features that are typically cost-prohibitive to retrofit to existing systems, the design stage offers you an opportune time to review requirements thoroughly and reduce excessive margins.
Hydraulic Institute (HI)Hydraulic Institute, the largest association of pump producers in North America, serves member companies and pump users worldwide by developing comprehensive industry standards, expanding knowledge by providing education and training, and serving as a forum for the exchange of industry information. In addition to the ANSI/HI Pump Standards, HI has a variety of resources for pump users and specifiers, including Pump LCC and VSP guidebooks, “7 Ways To Save Energy” training program and more. To download free executive summaries of HI’s “Pump Life Cycle Costs”, “Variable Speed Pumping,” “Optimizing Pumping Systems” and an index to ANSI/HI Standards, visit www.Pumps.org and www.PumpLearning.org |
Pump Systems Matter (PSM)Developed by the Hydraulic Institute, PSM is an educational initiative created to assist North American pump users gain a more competitive business advantage through strategic, broad-based energy management and pump system performance optimization. PSM’s mission is to provide end-users, engineering consultants and pump suppliers with tools and collaborative opportunities to integrate pump system performance optimization and efficient energy management practices into normal business operations. PSM is seeking the active support and involvement of energy efficiency organizations, utilities, pump users, consulting engineering firms, government agencies, and other associations. For more information on PSM, to become a sponsor, or to download PSM’s free Pump System Improvement Modeling Tool (PSIM), an educational tool designed to show pump systems engineers how modeling tools can reduce cost and conserve energy, visit www.PumpSystemsMatter.org. |


