Understand airflow to keep your plant cool in the summer
In many industrial working environments, air conditioning for summer working comfort isn’t an option; it’s a necessity. At the same time, many industrial buildings require large openings in their envelope for day-to-day operation; that’s not conducive to air conditioning. How does one solve this conundrum?
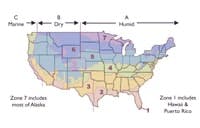
Figure 1. Climate classification in the country.
Putting the warm air into motion offers a practical alternative in many cases. It’s energy-efficient because there’s no need to chill the air; the airflow passing over exposed skin produces the cooling sensation. The approach is particularly suitable when elevated summer air temperatures coincide with high humidity. Much of the United States has a humid environment.
Climate zones
Climatic conditions everywhere in the United States vary seasonally and from year to year. Averaging climatic data over time establishes the climate classification shown in Figure 1. Table 1, on the other hand, shows typical summer air temperature and relative humidity characteristics of the seven U.S. zones. These data can be used to evaluate summer comfort and physical performance in well-ventilated, non-air conditioned, industrial environments with no significant indoor heat sources.
ET* and thermal comfort
|
|||||||||||||||||||||||||||
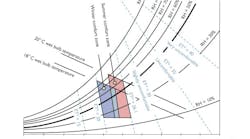
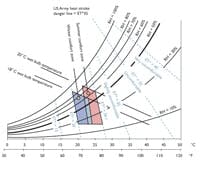
Probably the most common index of thermal comfort is the “new” Effective Temperature (ET*) developed by Gagge and others in 1971. This index is based on human physiological regulatory response that establishes environmental conditions equivalent to a Celsius air temperature when relative humidity is 50%. Lines of constant ET* have varying slopes when plotted on a psychrometric chart (see Figure 2). For purposes of comparison, a standard effective temperature (SET*) adopts a set of parameters. These are the use of operative temperature to accommodate radiation effects, clothing insulation value of 0.6 clo (a measure of the ability of clothing to keep you warm), an activity (metabolic rate) of one met, air movement less than 0.2 m/s and an exposure time of one hour.
Thermal comfort zone
Individual responses to the thermal environment vary. There’s no universal ET* that everyone perceives as comfortable, which explains why thermal comfort is defined as a range of ET* values bracketing the comfort zone.
Two such zones — for winter and for summer — are defined (see Figure 2). These zones account for peoples’ ability to adapt to seasonal changes by choice of clothing. Figure 2 also indicates various degrees of discomfort as ET* values.
| Temp (ºF) | 70 | 75 | 80 | 85 | 90 | 95 | 100 | 105 | 110 | 115 | 120 |
| 100 | 22.3 | 25.9 | 29.4 | 33.0 | 36.8 | 40.6 | 44.4 | 48.1 | 51.6 | 55.1 | 58.5 |
| 95 | 22.2 | 25.7 | 29.2 | 32.7 | 36.5 | 40.1 | 43.8 | 47.4 | 50.9 | 54.3 | 57.7 |
| 90 | 22.1 | 25.5 | 28.9 | 32.3 | 36.1 | 39.5 | 43.2 | 46.7 | 50.1 | 53.5 | 56.9 |
| 85 | 22.0 | 25.3 | 28.7 | 32.0 | 35.6 | 39.0 | 42.5 | 46.0 | 49.4 | 52.7 | 56.0 |
| 80 | 21.9 | 25.1 | 28.4 | 31.6 | 35.2 | 38.5 | 41.9 | 45.3 | 48.6 | 51.9 | 55.1 |
| 75 | 21.8 | 24.9 | 28.1 | 31.3 |
34.7 |
37.9 | 41.3 | 44.6 | 47.8 | 51.0 | 54.2 |
| 70 | 21.6 | 24.7 | 27.8 | 30.9 | 34.2 | 37.4 | 40.6 | 43.8 | 46.9 | 50.1 | 53.2 |
| 65 | 21.5 | 24.5 | 27.6 | 30.6 | 33.8 | 36.8 | 39.9 | 43.1 | 46.1 | 49.2 | 52.3 |
| 60 | 21.4 | 24.3 | 27.3 | 30.2 | 33.3 | 36.2 | 39.3 | 42.3 | 45.2 | 48.2 | 51.2 |
| 55 | 21.3 | 24.2 | 27.0 | 29.8 | 32.8 | 35.7 | 38.6 | 41.5 | 44.3 | 47.2 | 50.1 |
| 50 | 21.1 | 23.9 | 26.7 | 29.4 | 32.2 | 35.0 | 37.8 | 40.6 | 43.3 | 46.1 | 48.9 |
Table 2. Effective Temperature (ET*) look-up table. |
|||||||||||
Calculating the effective temperature is a complex procedure, but a look-up table (see Table 2) provides a close approximation.
Velocity equals comfort
Figure 2. Standard effective temperature (SET*) and ASHRAE comfort zones (after information from ASHRAE fundamentals handbooks).
Airflow’s cooling sensation is simple to estimate. At an air speed less than 40 fpm, there’s little cooling sensation. For constant air velocities between 40 fpm and 400 fpm, the cooling sensation is approximated by:
CS = (V - 40)/30 (Eqn 1)
Where CS = cooling sensation (F) and V = air velocity (fpm).
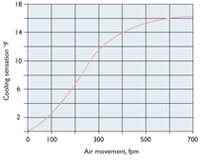
With this model, a constant air velocity of 400 fpm produces a cooling sensation of 12 degrees. A more sophisticated cooling sensation calculation takes into account the enhanced cooling sensation from air turbulence at low velocity and the decreased cooling sensation at air velocities greater than 400 fpm (see Figure 3).
Hot and muggy
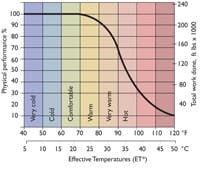
Effective temperature (ET) is an index of thermal sensation Dr. Yaglou developed for ASHRAE in 1923 and has been used widely during the past 80 years. This variable establishes an equivalence between the thermal sensation of an air temperature when relative humidity is 100 percent and other combinations of air temperature and relative humidity. ET overestimates the influence of humidity in cool-to-comfortable conditions, but is still useful in warm-to-hot and humid conditions. Yaglou used ET as the thermal index in a 1927 study, and NASA still uses it to compare human physical performance at elevated temperatures and high humidity. Results of this study are shown in Figure 4. There have been very few studies of this type.
Figure 3. Cooling sensation of airflow tapers off over 400 fpm.
Enhancement with airflow
One can estimate the potential enhancement of worker’s physical performance in hot, humid summer conditions. As the effect of airflow is a physiological cooling sensation, it can be taken as equivalent to a change in ET. For example, let’s compare the worker efficiency from Figure 4 for ambient conditions of 95 F effective temperature with the worker efficiency when an airflow of 400 fpm provides a cooling sensation of 12 F in effective temperature. In this example, initial worker efficiency is around 45%, but worker efficiency at 83 F (95 minus 12) is near 86%, which indicates that an airflow produces a worker efficiency enhancement of 83 minus 45, or 41%.
Estimating ceiling fan airflow
The use of 8-foot to 24-foot diameter industrial ceiling fans to enhance worker comfort and productivity is increasing. Dr. Richard Aynsley, Southern Polytechnic State University at Lockheed Martin in Marietta, Ga., measured the airflow from large ceiling fans in a recent study. He used the industry standard practice of measuring ceiling fan airflow four inches above the floor.
Figure 4. Physical work performance drops at ET* greater than 80° F.
A 20-foot diameter industrial ceiling fan operating at 60 rpm and rated at 370 W can cover approximately 57,000 square feet of floor with an airflow greater than 40 fpm. This provides a cooling sensation using an energy consumption of 0.0065 W/sq. ft. For a fan mounted 19 feet above the floor, Equation 2 can be used to estimate the air velocity as far as 30 ft. from the fan hub.
V20 = 135,000 / d1.65 (Eqn 2)
Where V20 = five-minute mean floor level airflow velocity (fpm) and d = distance from fan hub (feet).
A 14-foot diameter industrial ceiling fan operating at 84 rpm and rated at 370 W can cover approximately 53,000 square feet of floor with an airflow greater than 40 fpm. This provides a cooling sensation using an energy consumption of 0.007 W/square feet. For a fan mounted 19 feet above the floor, Equation 3 can be used to estimate the air velocity as far as 30 ft. from the fan hub.
V14 = 29,500 / d1.35 (Eqn 3)
Where V14 = five-minute mean floor level airflow velocity (fpm) and d = distance from fan hub (feet).
With energy costs rising, airflow from a large, industrial ceiling fan offers a practical option for enhancing worker comfort and productivity, particularly in hot and humid summer conditions.
Bill Buell is Director of Marketing and Hudson Tarianto is Technical Design Leader at Big Ass Fan Co., Lexington, Ky. They can be reached at 877-244-3267 or visit http://www.bigassfans.com.
