Don't allow motor repair practices to degrade motor efficiency
In the 1970s and 1980s, efficiency loss through core losses and repair practices became a concern in a number of industries. Trade associations and equipment manufacturers studied the relationship between core loss and temperature. This resulted in proposed recommendations for improving efficiency by reducing certain losses and several companies reviewed the potential of reducing losses through alternate coil removal practices.
The studies continued in the 1990s. The Canadian Electrical Association (CEA) studied a variety of losses incurred when motor repair processes are tightly controlled. Work on the mechanical aspects of traditional repair practices continued with research and published papers related to changes in soft foot and air gap.
Conclusions of the various studies were published and some repair facilities misinterpreted them as allowing for even more stressful repair practices.
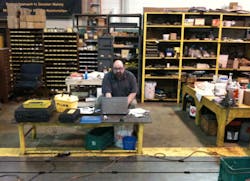
Figure 1. The 150-hp motor being prepared for testing on a 400-hp dynamometer.
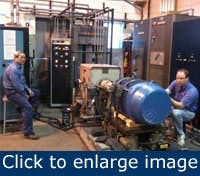
Figure 2. Collecting dynamometer and instrumentation data using Bluetooth technology.
In particular, the reference to 680° F and 750° F for high-grade core steel in burnout is related to the core temperature of the machine, not the oven temperature. The cited studies documented that the core temperature is an average of 120° F higher than the oven temperature. Therefore, setting the temperatures at 650° F and 750° F exceed the acceptable limits as did the practice of loading more than one stator at a time in an oven.
Of concern here is the relationship of repair outcome to the IEEE Standard 1068-20103, traditional repair practices, observations and precision motor repair (PMR) practices. The three electric motors used in these examples were evaluated for efficiency using IEEE Standard 112-20044 Method B (Segregated Losses). The changes applied to losses and evaluated efficiency are based upon allowable limits by standards and observed changes to machines. The various effects can be related to greenhouse gas emissions.
Evaluated machines
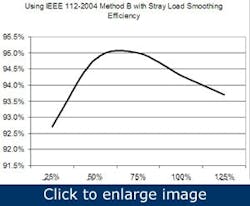
The three machines in question were 150 hp, 3 ph, 460 VAC, 167 A, 1,780 rpm that were measured for efficiency at load points 25%, 50%, 75%, 100% and 125% in accordance with IEEE Standard 112 Method B (Figures 1 and 2).
Motor losses are broken down as follows (Tables 1,2 and 3, Figures 3, 4 and Figure 5):
- Core losses consist of eddy-current and hysteresis losses. This is considered a constant loss in a constant-frequency environment.
- Friction and windage losses: fans, bearings and the machine’s surface friction. This is considered a constant loss.
- Stator I2R losses are the result of current passing through the stator’s DC resistance. This loss varies with current flow (load).
- Rotor I2R losses are the result of current in the rotor as with stator I2R losses.
- Stray load losses are the other losses, including magnetic fringing that weren’t included in the previous losses.
|
||||||||||||||||||||||||||||||||||||||||||||||||||||||||||||||||||||||||||||||||||||||||||||||||||||||||||||
{pb}IEEE 112-2004 Method B segregates these losses with the exception of eddy current and hysteresis and the various causes of friction and windage. Every loss is converted to heat, meaning the less efficient the motor, the more heat it produces.
Core losses from repair
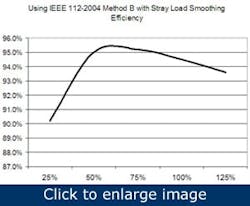
Figure 3. Unusual efficiency curve with the peak being closer to 50% load.
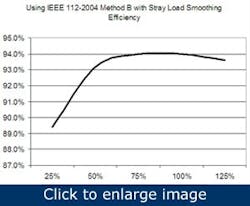
Figure 4. Normal efficiency curve expected for this motor.
Figure 5. Similar to figure 3, but shows that the three motors have different efficiency curves.
As one of the more significant discussions for roughly 40 years, the effect of the repair process on core losses should be addressed first. In the case of the three motors, the base core losses are 1,396 W for Motor 1, 2,661 W for Motor 2 and 1,625 W for Motor 3.
As published in several CEA studies (BC Hydro and Ontario Hydro repair studies), the efficiency loss from repairs varied by an average of 1% per rewind. The U.S. Department of Energy determined that the average loss would be 0.5% efficiency per rewind.
First, let’s assume the eddy-current losses make up half of the total core losses. Next, a review of IEEE Standard 1068-2010 indicates there is an allowable increase of 20% core losses per repair. We then also assume that standard temperatures were applied on a premium or energy efficient motor.
Research indicates that the increased allowable losses are almost completely attributable to eddy currents and the breakdown of insulation between laminations. The changes across the three sample machines and three rewinds can be found in Table 4, the resulting efficiencies can be found in Table 5.
Therefore, according to the IEEE Standard 1068, the allowable increase in core losses generates losses within the level estimated by the U.S. Department of Energy through core losses alone. The increased input necessary to generate the same loading on the dynamometer that would result in an increased current is shown in Table 6. This would be the additional energy needed to energize the additional core losses. However, it’s often found that motors operate with even higher current draw when returned after a standard repair.
If all other factors are equal, and a 179 A motor operated at 181 A after repair, how does that increase relate to the treatment of the motor? The increased losses would have to be on the order of 1,353 W in the core, or an increase of 97%. As these stator cores weigh 465 lb, the combined losses of 2,749 W translate to 5.9 W/lb. This would pass a core-loss test limit of 6.6 W/lb. The efficiency would drop to 93.4%, a loss of 1.1% efficiency. With losses almost doubled in the core, the heat generated would affect the insulation system’s expected life.{pb}
|
|||||||||||||||||||||||||
|
|||||||||||||||||||||||||
|
|||||||||||||||||||||||||
|
|||||||||||||||||||||||||
Increased stator I2R losses
The 2003 Motor Diagnostics and Motor Health Study, which was based on U.S. Department of Energy studies and EASA internal surveys, revealed that 81% of motor repair shops modify windings during the repair process. It revealed that 73% of the facilities made the changes for convenience, which included such actions as converting from concentric to lap windings and winding modifications to make it easier to insert wire. Each change affects the machine’s efficiency and reliability.
One way to fit wires into the slots of efficient machines is to reduce wire size, especially when thicker ground wall and other insulations are present, or the wire enamel is thicker than the original. On average, the decrease of one size (AWG) increases the resistance by 125%. Table 7 shows the effect on the motors in this study. The result of the reduced wire size would decrease efficiency in Motor 1 to 94.0%; 94.1% in Motor 2 and 93.9% in Motor 3.
Friction and windage
An interesting area in the Canadian studies was the loss of 3% efficiency attributed to the change of standard bearings to contact sealed bearings. If we assume the same 3% loss in the example machines (from 94.5% efficient to 91.5% efficient), the increase in losses would relate as follow:
- Motor 1: an increase from 197 W to 3,633 W
- Motor 2: an increase from 225 W to 3,624 W
- Motor 3: an increase from 185 W to 3,621 W
The bearing-related friction and windage losses are manifested as a temperature increase in the bearings.
Expectations from traditional repair practices
The allowable core losses exist within the latest standards, the wire change is not truly accepted, but does occur, as does the use of sealed bearings. You can reduce the efficiency loss with strictly enforced motor repair standards. Numerous studies within and outside of the industry during the past 40 years have confirmed this fact.
Using the above examples, the effect of the first rewind repair should the motors be operating 6,000 hours per year at a cost of $10/kW demand and $0.06 per kWh would be:
Additional core losses
Motor 1: $134 per year, 1 ton carbon emissions
Motor 2: $256 per year, 2 tons carbon emissions
Motor 3: $156 per year, 1.2 tons carbon emissions
Additional wire resistance
Motor 1: $300 per year, 2.3 tons carbon emissions
Motor 2: $228 per year, 1.7 tons carbon emissions
Motor 3: $317 per year, 2.4 tons carbon emissions
Additional friction and windage
Motor 1: 3,436 W, $3,710 per year, 12.5 tons carbon emissions
Motor 2: 3399 W, $3,670 per year, 12.4 tons carbon emissions
Motor 3: 3436 W, $3,710 per year, 12.5 tons carbon emissions
In the core loss example with the increased current draw, the result would have been 1,353 W, which results in an annual cost of $1,460 per year in energy plus 5 tons carbon emissions per year.
The losses are manifested as heat, and heat has a direct effect on the expected life of components, insulation systems and lubricants. As there are other factors associated with the quality of repairs that would result in such losses, you can expect that such practices greatly reduced motor reliability.
Precision motor repair
The key to improved motor repair practices is to move beyond the standards and specifications designed for average motor repair facilities and foster expectations for excellence. The program must include methods that eliminate the problems cited here.
[pullquote]
To eliminate the core loss problem, repair shops should perform a core loss test before and after the repair to verify no increased losses. The tolerance must be within the core loss tester’s tolerance. Any variation should be reported to and agreed to by the machine’s owner. It’s important to understand, as well, that previous damage is difficult to mitigate and that increases in core losses by any practice following the first improper repair can be expected.
Windings must be replaced with the same wire cross section and configuration, unless specifically requested otherwise. Bearings must be replaced with either original bearings or non-contact seals.
The appropriate application of precision motor repair practices results in efficiencies as original or better and the potential to operate for the life of the original machine. Proper precision motor repair also will identify the original cause of failure with information provided to an organization’s reliability department to improve system life.
Howard W Penrose, Ph.D., CMRP, is vice president at Dreisilker Electric Motors in Glen Ellyn, Illinois. Contact him at [email protected] and (800) 922-1882.
