In defining our future first we must understand our past. The late management guru Peter Drucker, when asked how he made such accurate predictions, said, “I don’t forecast; I look out the window and identify what’s visible but not yet seen.”
Help celebrate the 20th anniversary of the Annual Maintenance and Reliability Conference! MARCON 2016 will take place February 22-25, 2016, in Knoxville, TN, and will include a presentation by Paul Dufresne of this article, “A Reliability Journey – Defining Our Future.” The conference also will feature 10 workshops, keynote presentations by executives from Eastman Chemical Company, Pratt & Whitney Military, Microsoft, and Saudi Aramco, three tracks of paper presentations, and an exhibit area. Visit MARCON.utk.edu for more information, including details on group discounts and team meetings.
As reliability and maintenance professionals, to prepare for the future and to implement a new strategy, we must understand how our needs will change. If we are going to implement a new strategy or improve an existing one, we must first understand what will change for all involved stakeholders.
The reliability group at my facility recently performed an extensive review of our processes to determine areas of possible improvement and learned that, from operations to maintenance, process improvement has to be a total team effort. Here’s how we identified areas of improvement and how we deployed solutions that moved us from a reactive mindset to one that was proactive among all teams.
Identifying the issues
We began the project by determining the overall mean time between failure (MTBF) at the plant. Using plant failure data and completing a Crow/AMSAA Reliability Growth model, we were able to determine that MTBF was averaging approximately 14 days. Few on the team thought this data was surprising or unnerving: They were so numb to all the failures that they hadn’t realized the circle of despair that had become the new norm. However, the reality of the MTBF data also presented us with a challenge to make a difference in how the plant was operated and maintained.
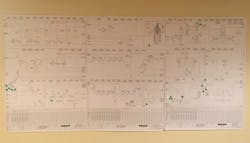
After admitting we had a problem, the next step was to determine how bad the problem really was. With the work of a few great individuals we pulled the failure data for the past three years and charted the dates on a simple wall calendar purchased from the local office products store (Figure 1). We color-coded the corresponding events and dates for each year and then posted the process flow diagrams (PFDs) of the plant on the wall, adding a colored dot to where each failure had occurred (Figure 2). The reason for this was to identify where the actual failures took place and the corresponding work orders that were written to make the repairs.
Figure 1. Charting equipment breakdowns through time can help make failure patterns more visible.
Figure 2. Using process flow diagrams can help identify the spatial relationships between failure clusters.
Upon review of the data, we uncovered a surprise: The locations where failures had taken place did not align with the locations where the majority of plant personnel felt our biggest problem areas existed.
We also discovered that just focusing on maintenance and reliability improvements would not get the job done. We needed to focus our attention also on the operations team. Your operators are your first line of defense when it comes to understanding the health of your assets, and the daily walk-around inspections they do can be a blessing or a curse.
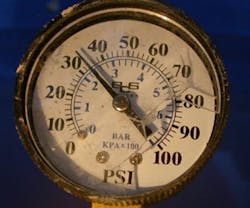
After walking down the inspection rounds with the operators, it became very clear that we had become numb to the noise of what our equipment was telling us. What I found were some basic items that in the grand scheme of things made a big impact on how we operate: broken gauges, busted conduit with exposed wiring, constant level oilers with oxidized oil, steam piping with missing insulation – and that was just on the first walkdown (Figure 3).
Figure 3.Uncovering opportunities for process improvement, from fixing broken gauges to repairing old or missing pipe insulation.
That first day of walking down inspection rounds with the operators made it very apparent that we had our work cut out for us. Looking back at our Crow/AMSAA data, we knew that we had 14 days until we could expect the next failure, so what to do? In talking with the operations group and discussing what we learned on our inspection walkdown, I noted our 14-day timeline until the next expected failure. As I looked around the room, some were in agreement, some were in disbelief, and some were caught in the middle. Based on what we were seeing, we had to retrain our focus and not settle for the norm.
Solution step 1: Operator basic care
Our first step toward retraining our focus was to re-examine our failure data and focus our efforts on where the “big clusters” of failures were located on the PFDs. After reviewing the current inspection criteria, we refocused our operator basic care inspections in those areas to address the issues we had experienced. Our new mantra was, “How do I keep the plant from tripping off line?”
The focus and attention of the group became one of “making a big deal out of little things” such as replacing broken gauges and ensuring steam lines had the correct insulation, and then inspecting the area and equipment when maintenance work was completed to make sure the job was done correctly. The old saying, “Just good enough; let’s get up and going and we will come back to it,” was no longer accepted. Our attitude was that if we make a big deal out of the “little things,” the “big things” will not be so prone to happen.
After this initial push with the operations team, we focused our attention on the maintenance and reliability teams. Similar to our focus on the operations group with Operator Basic Care, the focus with the maintenance and reliability teams relied on the P-F curve to guide our strategic change from reactive to proactive (Figure 4). We concentrated our initial efforts on the following areas: plant lubrication, predictive maintenance, precision maintenance, and planning and scheduling.
Figure 4. The P-F curve illustrates the power of early detection of anomalies.
Source:MaintenancePhoenix.com
Solution step 2: Plant lubrication
For the plant lubrication program, we addressed four primary focus areas: improved storage and handling, lubricant selection, training, and the execution of lubrication routes. We identified early on that the storage and handling of the lubricants used in the plant would need to be revamped, as the lubrication storage unit was not meeting the basic standards of industry best practices as they pertains to effective storage and handling (Figure 5).
For what we were wanting to achieve, the best (and only, in our opinion) decision that could be made was to move to a “clean room” for lubricants. This was a major change in the plant team’s mindset; the old mindset was “oil is oil and grease is grease.” The plant champion for lubrication developed a plan garnered supported from the plant leadership team. Partnering with a local solution provider, the lubrication clean room was designed, built, and installed.
Figure 5. Older lubrication storage units (left example) can evolve into a dedicated best-in-class lubrication clean rooms (right example).
During the lubrication clean room’s design phase, a plant audit/assessment of the current lubricants in use was conducted to identify our opportunities to make lubrication program changes, such as contamination control and improved filtration. We identified instances where we were using the incorrect lubricant for a given application based on operational and environmental conditions. We also were able to identify opportunities where we could consolidate lubricants without compromising the reliability of the equipment.
While the lubrication clean room was being built, the focus turned to lubrication training, where appropriate plant personnel were asked to participate in Machinery Lubrication Technician training. Upon completion of training and certification we took the information provided in the plant lubrication audit/assessment and developed plant lubrication inspection points and routes using MAINTelligence™ software. With effective route execution taking place with personnel that were trained and with all plant equipment identified and in the program and with performance metrics in place, significant improvements were seen immediately.
Solution step 3: Predictive maintenance
The plant predictive maintenance (PdM) focus was on two primary technologies: vibration analysis and oil analysis. The plant was already executing both but, based on our failure data, it appeared that something was missing.
The plant vibration program underwent an external audit/assessment from a third-party expert and many items were discovered from missing data and missing inspection points to routes that were not being executed at the correct frequency. It is important to note that during this evaluation, it was mentioned by one of the plant leaders that they believed the program was being conducted because they saw someone with a data collector. The vibration program was overhauled to ensure everything from initial point setup, missing points and routes are now being executed and that the performance metrics are in place to maintain the validity of the program.
For the oil analysis program the focus was on identifying and qualifying the equipment for acceptance into the program. The two primary goals of this program are to understand the condition of the oil and the condition of the equipment. Once identified the equipment was assessed for proper sampling point locations, the proper sampling hardware was identified and installed. The proper frequency, test slates and performance standards were also established. A complete tracking system and performance metrics were established and are tracked and reported monthly.
The next steps for the predictive maintenance program are to develop and incorporate thermography and ultrasonic leak detection routes. The current vibration and oil analysis programs are working and thriving through the continuous improvement cycle. Areas of focus are now moving into wireless sensor technology, which links our databases to a single platform.
Solution step 4: Precision maintenance
Along with addressing lubrication and predictive maintenance, we recognized that an overhaul of our maintenance practices was necessary if we were to be successful. Maintenance gaps and training deficiencies existed, so we quickly developed a plan to train our workforce on precision maintenance standards.
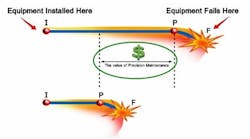
Training alone will not prompt the necessary changes in an organization. Precision maintenance has to be ingrained into everything you do for it to be effective, from creating work orders to selecting tools to training and follow-through. This will allow the program to take on a life of its own and let you achieve the program’s true value (Figure 2). We continue to make improvements in the program and have developed a long-range training program and partnership with the help of a third-party industry expert.
Figure 6. Precision maintenance can be applied to increase the I-P interval on the classic P-F curve.
Solution step 5: Planning and scheduling
The final focus area of our effort was on effective planning and scheduling. Two of Dr. Deming’s quotes were never more true as we pulled back the layers of our plant onion: “Your system is perfectly designed to give you the results you are achieving,” and “People cannot be more productive than the system they are working in allows them to be.”
A complete overhaul of the planning & scheduling function was conducted, starting with the support of a third-party industry expert who conducted an assessment as well as coached and mentored our team on effective planning and scheduling. Aligning this effort to our current work process has allowed to make great improvements in this area. The fact that we write work orders immediately after a defect identified from our Operator Basic Care, Lubrication, or Predictive Maintenance programs have allowed the planning and scheduling process to work. We have begun the transition from a completely reactive organization to a more stable predictive one.
Conclusion: From reactive to proactive
As a result of our Operator Basic Care, Lubrication, Predictive Maintenance and Planning & Scheduling efforts:
- MTBF has improved from 14 days to more than 63 days
- The percentage of oil samples being in an alarm state has been reduced from a high of 90% to < 0%
- We have drastically reduced lubrication-related failures by 70%
- Rotating equipment issues are being identified earlier through our vibration program, which has allowed us to effectively plan and schedule repairs in a manner where we have been in control of the process and not in a reactive mode
- The number of repeat failures and rework has been reduced via our precision maintenance program as we are continuing to improve this effort.
- Last year we experienced a 20% reduction in unplanned events.
Paul Dufresne is Reliability Group Leader for Koch Industries, Inc., and currently works at Koch Fertilizer in Wichita, KS. He has more than 20 years' experience in maintenance and management, and has earned CLS, CMRP, CPMM, CRL certifications. Contact Paul at [email protected].
Of the most importance, we are instilling better confidence in our team and fostering a greater sense of fulfillment in the work executed and the value created by both operations and maintenance and reliability teams.
In an effort to define our future, one has to understand where you came from. Being in a constant “fire-fighting” state of operation is not healthy for any organization. The efforts discussed here and executed by many great individuals have laid the foundation for changing the culture of an organization for the better. Our future is present as the actions we are taking today will define what the future holds for us.
