Most large industrial plants have adopted infrared (IR) thermography as part of its predictive/preventative maintenance (PPM) operations. The technology has proven its value by revealing conditions hazardous to personnel, and those that are precursors to equipment failures that cause lost production. The use of IR camera scans is based on the fact that many types of equipment anomalies cause a temperature rise associated with an impending failure or fire. IR cameras can identify these conditions in both mechanical and electrical equipment by providing non-contact temperature measurements and thermal images of the equipment. IR scans are especially valuable for improving the safety of electrical equipment by helping personnel identify potential fire and shock hazards.
Loose connections = power losses
In electrical gear, one of the main threats to safe, ongoing operation is poor connections. These can be caused by faulty installation, equipment vibration, temperature cycling, and failure to tighten connections properly after repair work. Beyond safety issues and outright failures, there’s another often overlooked problem that loose connections cause – power loss from increased contact resistance.
The temperature rise in most electrical circuits is primarily caused by power dissipation from Ohmic heating. This is particularly true of electrical contact junctions, where inductive and capacitive reactance losses are minimal. Therefore, using Ohm’s Law, the power loss at a junction can be calculated from the equation P = I2R, where P is the power dissipated in watts, I is the current through the junction in amperes, and R is its contact resistance in ohms.
[pullquote]When making electrical connections, the intent is to make contact resistance as low as possible to minimize power loss. If connections are loose, R is higher, as is the power loss and the temperature at that junction. This means the circuit is operating inefficiently and drawing more power from the electrical supply than necessary — the greater the current, the greater the power loss. While one loose connection might not cause much power loss, there can be many of them in a large plant. If current and contact resistance is high enough at these loose connections, they can cause a significant increase in a plant’s electrical utility bill over the course of a year.
Needles in a haystack
Many clients already reap many PPM benefits from IR inspections, but during the economic downturn, some are looking for additional ways to save. Generally, they want a focus on IR scans to locate and fix anomalies that are critical for safe, uninterrupted operation. However, we’ve come to believe there is significant economic benefits in fixing loose connections that drain power unnecessarily. This situation is analogous to using ultrasound surveys to find and repair air leaks, gas leaks and malfunctioning steam traps. These PPM programs can greatly reduce heating costs and the cost of producing compressed air for plant equipment.
Figure 1. Typical IR camera used for PPM thermography (Photo courtesy of FLIR Systems, Inc.)
While it’s a good idea to identify loose connections, finding them can be a bit like finding a needle in a haystack. It’s just impractical to go around taking electrical measurements on every connection in a plant to find the really bad ones. Fortunately, thermography using and IR camera (Figure 1) can make this task a lot easier by scanning large areas of plant equipment for abnormally high temperatures. Still, proper methods must be followed, including the appropriate analysis and calculations.
Some of our larger plants agree that fixing loose connections on equipment that consumes lots of power might have results similar to fixing air and gas leaks, but they want economic justification in the form of hard numbers on the cost savings that could be achieved from IR inspections. This is part of a broader business trend we see, with more companies using efficiency studies to justify maintenance work through real-time cost savings. Therefore, we try to validate the methods for finding loose connections and associated power losses.
Validation methods
The aim is to establish simple techniques and calculations that are easy for thermographers to use. Rather than trying to find exacting methods with a high level of precision, we were looking for good approximations of power loss that, when corrected, would be high enough to show a positive payback on the time invested in IR scans. We recognized that this would vary from plant to plant, because each one could have a different unit cost per kilowatt-hour. However, the general approach would have to be the same for every plant.
The validation procedure was to gather non-contact temperature data from electrical junctions with an IR camera and use that as the input to a mathematical model for calculating thermal heat losses. This model uses conventional equations for heat transfer via convection and radiation. The thermal heat loss was then compared to a calculation of power dissipation using Ohm’s Law. However, instead of using P = I2R, we measured the voltage across the junction (ΔV), current (I) through it and calculated the power loss using P = IΔV. Note that contact resistance can be calculated from R = ΔV/I.
{pb}If the two methods are in reasonably close agreement, then either could provide a decent estimate of power loss, and a thermographer should feel comfortable in using IR camera scans for this purpose. As a practical matter, it’s the largest losses we want to find and correct, i.e., those that draw large amounts of current. By summing losses that might not appear serious individually, and multiplying by the plant’s kW-hour unit power cost, we can project the cost savings from a PPM program.
Test results
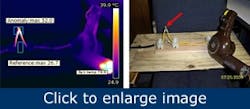
We ran a simple bench test to verify the thermal calculation model under controlled conditions. We rigged a loose connection in an electrical line feeding a 120-VAC hair dryer. The thermal data is shown in the left view of Figure 2. The resulting thermal loss calculation was compared to the P = IΔV calculation from electrical meter measurements across the loose connection.
Figure 2. This thermogram/photo shows a bench test using a hair dryer as the electrical load in a 120-VAC circuit. The intentional loose connection is shown by the red arrow.
The IR thermal loss model showed 1.2 watts of power lost at the loose connection. Electrical measurements indicated 5.6 amps through the circuit and a drop of 0.38 V across the loose junction. Plugging these measurements into Ohm’s Law, suggests the power dissipation is 2.13 W. Although the value calculated with the thermal loss model is substantially lower, this can be easily explained by the difficulty in estimating the junction surface area used in the calculation. This simple test points out two things:
- The need for a reasonably good estimate of junction dimensions
- Small power losses, such as this test examined, aren’t likely to justify IR scans
Still, power loss calculations from this test were close enough to encourage further investigation. The next step was to conduct validation tests on full-scale plant equipment having much greater electrical loads.
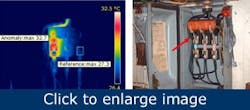
Motor circuit test The second test was conducted in one of our customer plants. We collected data from the fuse box for a 480-VAC, three-phase motor circuit (Figure 3), which had a bad connection on one of the fuses. The intent was to check the loss calculations for a thermal anomaly with a greater load current and junction surface area than we used in the bench test. In addition, we wanted to check the thermal model under conditions where there is a small difference between the junction and background temperatures. In the bench test there was about a 25°C difference; in this test the difference was about a 5°C.
Figure 3. Thermogram/photo pair of a test conducted on a faulty fuse connection in a 480-VAC, three-phase motor circuit.
Using the IR thermal loss model, we calculated 0.2 W of power lost at the loose connection. The voltage drop across the junction was 0.102 V, and a current through the circuit was 24.9 amps. Using Ohm’s Law, we get 2.53 W of power dissipation. This was even more disappointing that the results of the bench test.
While temperature is related to thermal energy, there’s no absolute correlation between an object’s thermal energy and its temperature. Temperature measures the concentration of thermal energy in an object in much the same way that density measures an object’s concentration of mass. As a result, a large object will have a much lower temperature than a small object having an identical amount of thermal energy. Therefore, it’s important to validate thermal loss measurements with electrical power dissipation measurements at the beginning of a PPM program of this type.
Figure 7. Screen capture of input form for electrical junction dimensional data in English units.
Determining the thermal energy radiating from a three-dimensional body is extremely difficult. Frequently, the mathematics can be simplified by breaking a 3-D object into 2-D or 1-D segments without sacrificing accuracy. In this study, we used a model developed by Robert P. Madding [1] of FLIR’s Infrared Training Center (ITC) (Figure 2).
A poor estimate of the junction surface area above the fuse in question probably accounts for some of this and is exacerbated by the small ΔT. There also might be a problem is using a unity view factor, F, to calculate the radiative loss. (Sidebar 1) In addition, we might have used the wrong emissivity value, and using a reference temperature based on one of the other fuses might not have been the best comparison. We probably should have used the lower background temperature. These factors notwithstanding, the conclusions we drew from this test were basically the same as those from the bench test.
Electric furnace test At this point, our gut feeling was that we needed an application where we could reasonably estimate junction surface area, and we needed much higher current through the junction than in the first two tests. With higher power usage, we also expected to see a much larger temperature difference between the junction and ambient temperature.
We found these conditions at a plant that produces a large volume of materials for sale on a global scale. It has several high-power electric furnaces, housed in multiple buildings. The plant uses between $300,000 and $500,000 per month of electricity to supply the furnaces, which produce temperatures of 2,000ºC to 2,800ºC and higher. Plant management relies on diligent maintenance to keep these furnaces and their aging electrical system operating.
While the plant and its electrical system are more than 100 years old, the company has remained competitive in its global marketplace by being efficient. Nevertheless, management is always looking for ways to reduce operating costs and improve profitability. This was the motivation for having us conduct a power loss study.
{pb}Using this model, we calculated convective and radiative heat transfer from electrical junctions that were approximately box-shaped. The area for each side of the “box” is measured separately and used for the heat transfer calculations. Conduction is certainly taking place at metallic electrical junctions, but whatever it is, the electrical junction will still be at some equilibrium temperature we can use for calculating the heat transfer by convection and radiation. By ignoring heat lost by conduction, we are admittedly underestimating the total power loss at the junction. So the resulting calculations present a conservative picture.
Figure 8. This is the format for the output data for a cylindrical shaped thermal radiator.
In Madding’s model, BASIC program algorithms are embedded in a Microsoft Excel spreadsheet to calculate surface areas (Figure 7) based on a user’s dimensional inputs and then calculate the power loss from those surfaces based on non-contact temperature measurements from an IR camera (Figure 8). Either English or metric units can be used.
In this model, one algorithm calculates convection heat transfer from a surface as described by Newton’s law of cooling using:
Qcv = hcv A (Ts - Ta)
Where hcv is convection heat transfer coefficient
A is the surface area
Ts is surface temperature
Ta is the air temperature
The model’s radiative heat transfer is calculated for a Gray Body (which has an emissivity between zero and one) using:
Qrad = ε F σ A (Ts - Tb)
Where ε is the emissivity of the surface (dimensionless)
F is the view factor (dimensionless)
σ is the Stephan-Boltzmann constant
A the surface area
Ts is the surface temperature
Tb the background temperature
While these equations typically use metric units, the computer algorithms in the Madding model allow inputs in either English or metric units of inches/°F or meters/°C.
For the electrical junctions studied, ε was estimated to be 0.95. The view factor, F, was assumed to be unity, i.e., the camera views the surface at a perpendicular angle. We input junction dimensions to the spreadsheet, which calculates A. The IR camera measures Ts and Tb. Ta is assumed to be the same as Tb. Each thermal loss calculation was compared to the power dissipation calculated from Ohm’s Law. The latter was based on voltage and current measurements at the junction.
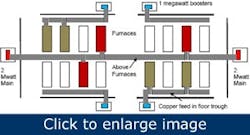
The power feeding the furnaces is single-phase 2,300 VAC from multiple control-tapped transformers for each furnace building. Parallel 8 in. x 8 in. x 0.5 in. copper bus bars feed each furnace. The general arrangement is shown in Figure 4. A building might house up to 24 furnaces, each one being approximately 14 x 50 feet long. The furnace building is supplied by two or four booster transformers for start up, and then parallel units to maximize the current and firing temperatures. Each booster transformer is rated at one megawatt, and the parallel transformers are rated at two megawatts each.
Figure 4. Simplified block diagram of a furnace building with booster and main transformers. Electrical feed lines are copper bus bars.
The booster transformers feed the furnaces from a trough in the ground and the main parallel transformers supply power to the furnaces from overhead copper bus bars. The 2,300 V on a transformer primary is reduced to an output of 30 V to 100 V on the secondary, giving the potential for 3,000 A to 4,000 A of current to each furnace.
During our tests, plant engineering personnel measured the voltage drops and currents using a voltmeter and a flexible current tap transformer that went around the copper bar connections. Figure 5 shows the IR and digital image for one of the test locations that involved a loose connection on a booster transformer feed bus.
Figure 5. Thermogram/photo pair of copper bus connection with anomaly on the righthand phase.
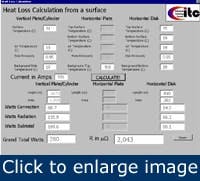
The box model form sidebar 1 was used to input bus bar dimensions. There are two parallel bars associated with the loose connection. One set of IR measurements was taken for the 8 in. x 14 in. bar, and the second set was from the vertical at the 8 in. x 8 in. bar. The resulting power loss calculations are shown in Figure 6, a screen capture of the Excel spreadsheet output. The total power loss from both bus bar surfaces was calculated to be 1,354 W. The associated dissipation from electrical measurements was 0.41 V x 3,371 A = 1,383 W. These values are only about 2% apart.
Figure 6. Excel spreadsheet output screen for the loose connection shown in Figure 5.
The energy cost associated with this loose connection is based on the plant’s electric rate of $0.039 per kW-hour. Dividing the result by 1,000 converts this to an hourly cost. Doing these calculations we found:
Cost/hr = ($0.039/kW-H) x 1.354 kW = $0.05/hr.
Because the plant operates 24/7 most of the year, this small hourly cost becomes significant. Subtracting a reasonable number of hours for planned shutdowns, the plant is in operation for somewhere around 8,000 hours a year. Therefore, the annual energy cost for this one loose connection is about $400/year.
As it turned out, plant engineering cleaned and tightened this bad connection and retested it. Using their electrical voltage measurements across the junction with the same current flow as before, they calculated a cost savings of $0.07/hr of run time. They corrected six other loose connections, which resulted in a total cost savings of $0.44/hr. This amounts to an annual cost savings of about $3,500/year.
As part of our validity study, we checked two other loose bus bar connections on other furnaces. The results are:
Furnace bus bar test #2: Calculated thermal loss with infrared measurements = 1,838 W Calculated dissipation with electrical measurements = 1,691 W
Furnace bus bar test #3: Calculated thermal loss with infrared measurements = 3,720 W Calculated dissipation with electrical measurements = 3,243 W
Analysis
“Finding Internal Electrical Resistance from External IR Thermography, Robert P. Madding, FLIR ITC, Billerica, Ma, 2001.
“Nondestructive Testing Handbook — Volume 3,” Infrared and Thermal Testing, Technical Editor Xavier P.V. Maldague, Editor Patrick O. Moore.
Acknowledgements
The author wishes to thank the Infrared Training Center (ITC) at FLIR Systems for its training and use of the excellent FLIR equipment. Many thanks to Dr. Robert P. Madding, former Director Infrared Training Center, FLIR Systems, Inc. The author would also like to thank his customers for providing the resources to make this work possible.
These studies show that IR thermography can be a valuable maintenance tool that helps save on electrical energy costs. For equipment that consumes a lot of power and operates with high current flows, using IR scans to find loose connections is easily justified by simple economics. Still, to get valid results, it’s important to use the proper measurement techniques, such as using an ambient radiant reference of the surrounding area instead of a similar material in the same circuit. In addition, being more exact on the emissivity value you use for IR measurements could improve your results. Some initial studies using the Madding model also might improve dimensional estimates. On the other hand, results don’t have to be highly accurate to justify this technique. In many cases, results within 10% to 15% are probably good enough. In the electric furnace case, loose connections not only raise the hourly cost of operation, they also slow down production by extending the time it takes to get to the proper firing temperature.
Besides the direct economic value of finding and correcting loose connections, IR scans can help maintenance crews plan work more effectively. In a more general predictive/preventive maintenance context, IR scans are a maintenance tool for finding anomalies that might cause catastrophic equipment failures, loss of production, potential for fires and other safety hazards. These uses of IR thermography are designed to trigger corrective actions that will have the greatest economic effect in the shortest possible time.
Larry Massey is a Level I thermographer and Level III vibration analyst at Massey Technical Services LLC in Bridgeport WV. Contact him at lmassey@ma.rr.com and (304) 842-6948.


