Condition monitoring should always start with a list of machine faults, specific for each machine. Only if you know exactly what you expect from the monitoring method, can you apply it efficiently and correctly. Otherwise, there is a danger that you will simply be collecting data. And data is of no use unless it is converted to useful information that you can act upon to realize your true goal of maintaining plant equipment in good working order.
[pullquote]When we look at the rotating component that gives us the most concern, it usually comes down to the bearing. I think it’s fair to say that 70-80% of rotational problems are bearing related. Whether the causes are due to under or over lubrication, contamination, installation faults, secondary forces or just plain fatigue, we need to know the operating condition of bearings most frequently. So it’s very important to determine the best technique for identifying your particular bearing problems. The other rotational problems certainly need to be identified as well, so again, choose the most cost effective, efficient technique to accomplish that.
How do you run a cost efficient, effective condition based monitoring program? Start by selecting the appropriate technique for the application and for the type of answers needed. As a general rule, you can apply the 80/20 rule in many facilities. That is, around 80% of equipment needs to be monitored without the need of spectral data and large amounts of data collection. You could then utilize spectrum analyzing only on the equipment that needs it. For those pieces of equipment that are so critical that periodic monitoring is not enough, then continuous monitoring needs to be considered.
The Shock Pulse Method (SPM) is the front line technique the Hallsta Mill in Sweden chose to quickly manage input from its 800 rolls, with 4000 machines and 6,000 measurement points. With eight inspectors, they need a quick method to know whether bearings need to be greased or not, or that damage is present and needs to be monitored more frequently.
What is Shock Pulse?
What we loosely call ‘machine vibration’ is a very complex form of movement that has many different causes and that can be described and measured in many different ways. Vibration exists in all machines with moving parts, because some of the force, which makes the machine work, is directed against the machine structure and tries to shift it from its position. Thus, vibration is normal up to a degree, and all machines are constructed to withstand a certain amount of vibration without malfunctions. In order to use vibration monitoring to diagnose machine condition, we have to:
- Find a suitable way of measuring vibration, and
- Decide what normal vibration is and what excessive vibration is for any particular machine.
All vibration measurement starts with a time record, a registration of vibration over a length of time. A transducer converts the movement into an electric signal, which an instrument quantifies, displays and stores. The signal can then be evaluated in terms of ‘good’ or ‘bad’.
One way of looking at vibrations is to define the type of force, which causes it. Most industrial machines are rotating, so the main force is rotational, operating on masses which are imperfectly balanced. This accounts for approximately 99% of the total vibration energy. Rotational forces are continuous and cyclic – the force does not stop (while the machine is running under power) and the movement is repeated once per revolution of a part. About % of machine vibration is due to shock. Shock forces are not continuous but can be repeated, either at regular or irregular intervals. The remaining small amount of vibration, about 0.1%, is attributed to frictional forces.
Even bearing damage can be detected through vibration analysis. A bearing produces a group of peaks in the vibration spectrum, caused by the rolling elements passing, at different speeds, over the inner race and the outer race, and by spinning around their axis. A further peak is caused by cage rotation. Given the small mass of the bearing in relation to the large mass of the machine, these peaks normally have very low amplitudes and many times are difficult to pick up with a spectrum before there is severe damage.
A shock pulse transducer contains a reference mass (m) and responds with a dampened oscillation when hit by a shock wave. Attached to the reference mass is a piezoelectric crystal which produces a voltage when compressed by the movement of the reference mass. This voltage is proportional to the amplitude of the oscillation and thus to the energy of the shock wave. The principle is the same as used in accelerometers for vibration measurement. There is, however, an important difference.
When a mass is excited at its resonance frequency, it will oscillate with much greater amplitude than at any other frequency. For vibration measurement, one normally stops measuring far below the resonance frequency of the transducer. On the other hand, shock pulse meters are mechanically and electrically tuned to operate exclusively at their resonance frequency of 32 kHz (fm), where the resulting signal is strongest. This gives us a very sensitive transducer for shocks only, but which will not react to "normal" machine vibration frequencies.
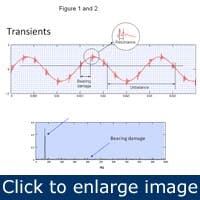
{pb}When a ball hits a damaged area in the raceway, it produces a shock wave. Shock waves are "transients" or short-lived waves starting with relatively high amplitude that quickly dampens out. In a time record displayed by an oscilloscope, these transients are often clearly seen, superimposed on the continuous wave produced by shaft rotation (see Figure 1). When the distance between transients is constant and corresponds to the ball pass frequency, this is clear evidence of bearing damage.
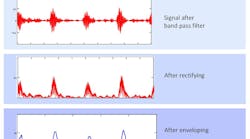
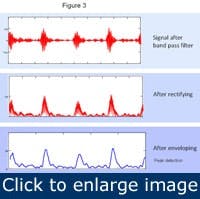
In the spectrum, however, peak amplitude is determined by the energy contents of the vibration at any given frequency. In relation to the energy at the shaft frequency, the energy of the shocks produced by the damaged bearing can be negligible. Thus, the ball pass frequency line has low amplitude and is easily lost among the”noise”, as shown in Figure 2. In the area around the resonance frequency, we can record a time signal, which clearly shows the transients produced by the damaged bearing. Each shock is a single event,
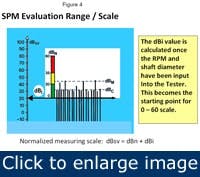
The dBi value is calculated once the RPM and shaft diameter have been input into the Tester. This becomes the starting point for 0-60 scale.
Many years ago SPM took the Shock Pulse technology and developed it into the Shock Pulse Method. Through actual testing in bearing test labs, empirical data was developed by using the bore diameter and rpm. With this info a dBi value is determined, which positions the normalized condition color alarm scale onto the dynamic range of the shock pulse transducer. This enables users to utilize a standardized alarm scale, regardless of the rpm or bearing bore diameter (see Figure 4). The dBm is the maximum value, the measured value of the strongest pulses detected during the measuring interval. While the bearing surfaces are undamaged, the difference between dBm and dBc (decibel level Carpet) is small. A high dBm and a large difference between dBm and dBc are caused by surface damage or foreign particles between rolling element and raceway.
What is the Shock Pulse Method?
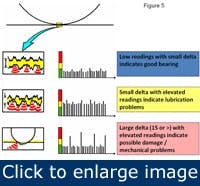
Due to the sensitivity of the Shock Pulse Method, bearing lubrication condition is measurable through the signal monitored as dBc. The dBc is measured in the time wave signal of the shock pulse transducer. The filtered transducer signal reflects the pressure variation in the rolling interface of the bearing. When the oil film in the bearing is thick, the shock pulse level is low, without distinctive peaks (green area, Fig 5). The level increases when the oil film is reduced, but there are still no distinctive peaks (yellow area, Fig 5). Damage causes strong pulses at irregular intervals (red area, Fig 5).
In 2002, SPM expanded the SPM Method by performing an FFT on the same 32 kHz signal utilized, which resulted in a more in-depth analysis capability. By identifying the different bearing frequencies (symptoms) we can now see the matches of those frequencies within the SPM Spectrum. Likewise typical symptoms such as imbalance or looseness can also be introduced for more accurate pattern recognition. The x-axis of the SPM Spectrum is scaled in Hz. The y-axis is in SD (Shock Distribution unit).
The amplitude in the SPM spectrum should be used in conjunction with the SPM values. A new damage can cause high SD readings and an older more severe damage can have lower SD values. Primarily the SPM Spectrum is used for pattern recognition. It is known, but not quantified, that the delta (difference between high peaks and average level) in a spectrum is related to the bearing status.
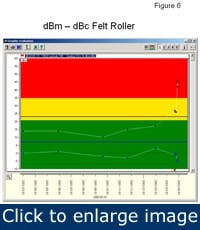
Figure 6 shows a typical Shock Pulse Bearing Condition chart. The x-axis represents the time frame. The Y-axis is signal strength intensity divided up as a Green-Yellow-Red condition code. As explained earlier the Alarm level is determined by the shaft diameter and RPM that is programmed into the instrument and/or the PC software. That defines the baseline and from there the Green/Yellow/Red divisions are further defined. On the chart we see the readings in the Green zone until about March 2002. Then they take off into the Yellow then the Red zones. Plus we see the development of a large delta (dBm-dBc), which also indicates bearing damage in progress.
Refiners are critical pieces of equipment in the paper making process. They are the part of the process that breaks down the cellulose fibers, helping them stick to one another in the paper web. With a series of rotating serrated metal disks, refiners “beat” the pulp for various lengths of time depending on its origin and the type of paper product that will be made from it.
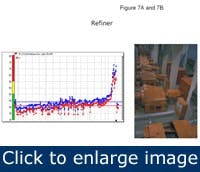
{pb}Figure 7b is an on-line history identifying a bearing in the RED zone. It identifies damage in progression, bearing replacement and then new lower readings as a result of a new bearing. This was accomplished using only the shaft diameter and rpm. A subsequent SPM Spectrum (Figure 7c) on the same location identifies the problem area as the inner raceway. The pattern displays as an inner race defect with sidebands. If the philosophy of front line condition monitoring is utilized, shock pulse measurements would be utilized as the first stage of identifying anomalies. Because the shock pulse transducer is “seeing” only the bearing signal, it makes the analysis of bearing condition easier to see, and provides an earlier call. With this technology, when the shock values rise and the delta (difference between dBm/dBc) increases over time, that is a prime indicator that bearing damage is in progress.
And by using the SPM Spectrum, you can clearly identify bearing problems from secondary signal sources. The matching of symptoms (bearing components) makes the decision making process smoother.
In the SPM Spectrum (Fig 7c) we do an FFT on the unique Shock Pulse signal that is developed only from the compression waves being generated by the operating bearing. The individual frequencies, or symptoms, are predefined, and we simply match the symptoms with the signal patterns of the components that caused the Shock Pulse Method to go into the red. The software identifies the matches and the Y axis (shock distribution scale) identifies which symptom is generating the most shocks.
Between the SPM Method identifying the bearing and the SPM Spectrum identifying the bearing component with the greatest shock saturation, the bearing call can be made more easily.
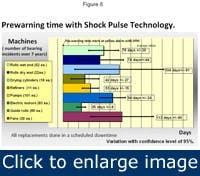
Remember the mill in Hallsta, Sweden that utilizes the SPM Method and the SPM Spectrum. They produce over 785,000 tons of magazine, book, office and newsprint paper per year. Hallsta personnel compiled data from 993-99 on over 2326 pieces of machinery in their facility, and their average warning time is shown in Figure 8. Because of the extended warning before failure, 00% of replacements were able to be completed during a scheduled shut-down. They calculated that this worked out to be an $800,000 contribution to profit per inspector, or $6,400,000 in total. They have a 95% confidence level for the average prewarning times. When the bearing condition first goes from green to yellow, and lubrication correction does not reverse the trend, these values represent the average warning time for bearing replacement. With this knowledge, they now use these average values to determine the corrective action and the time to replace. The main arguments for condition based monitoring are the considerable cost reductions achieved by reducing the time it takes to make a necessary repair. A planned replacement means less waiting time and less repair time. When you also add the cost for secondary damage and lost production resulting from a breakdown, it is easy to understand why an effective CBM program costs far less than a run.
