Energy is one of the most fundamental parts of our universe. We use energy to do work, to light our cities, to power our vehicles, trains, planes and rockets. Energy warms our homes, cooks our food, plays our music and gives us pictures on television. Energy powers machinery in factories. Energy is the ability to do work.
Energy is one of two types, depending on whether it’s moving or stored. Stored energy is called potential energy. The moving variety is called kinetic energy.
Air, when compressed, represents potential energy that can be used in a variety of ways. Humans began to compress air and apply it to widespread and diverse uses about 100 years ago. Early compressors were steam-driven, but in other respects were essentially the same as today’s models, differing only in refinement of materials and tolerances. The compressor then, as now, delivers air under pressure into a storage vessel or directly into the piping network for distribution to points of use. The controlled release of air pressure on pistons, against rotating blades, and through orifices represents the kinetic energy that powers the air components and instruments common throughout industry.
When applying compressed air as a utility in your process, the desired result usually is some form of work (as in force through a distance). The work that’s available through the use of compressed air is a function of the weight of the air. It’s weight that does the real work.
[pullquote]Let’s say you have a compressed air receiver that’s loaded to 100 psig. It was work produced by various types of energy that compressed the air, now representing potential energy. If potential energy is to do work, it must be transformed to other forms of energy. The transfer occurs when the force of air pressure is applied to a tool or pneumatic device. Force, the product of mass (weight) times acceleration (movement in the direction of force), is the key word here. The tool or device is more concerned about how many pounds per minute (weight) are being delivered.
The first and foremost complaint from an operator or production area is, “I don’t have enough pressure.” The problem is actually a flow restriction that manifests itself as low pressure. There are many reasons certain areas of a plant might lack sufficient air pressure. At many facilities, however, some production machines require large volumes of air to actuate large, fast-acting cylinders. The more that air cylinders are working in tandem, the greater will be the peak flows that most point-of-use piping and valves simply can’t handle.
If point-of-use components such as filter/regulator/lubricators (FRLs), quick disconnects, piping and hoses aren’t sized properly for the end-use tool, the result is a restriction to the mass flow and a poorly performing tool or a production machine that fails to produce consistently. The quick fix is to increase the end-use pressure by cranking the regulator fully open to increase the available mass. If the performance still is unacceptable, the knee-jerk reaction is to raise the pressure in the entire air system.
It’s true that both of these solutions increase the available air mass and, thus, offer the appearance of a good resolve. But increasing the system pressure carries significant penalties in operating cost. In most rotary screw compressors, for example, every 1 psi change from rated pressure changes the required brake horsepower by 0.5%. Increase system pressure by only 10 psi and the power consumption goes up 5%.
Also, deviations in discharge pressure from the compressor’s rated pressure change the overall compression ratio. Compression ratio shifts change the compressor’s volumetric efficiency, which results in changes in capacity. A good guideline is that increasing the pressure by 10 psi causes a reduction in capacity of about 0.4%.
Reduce pressure drop
Excessive pressure drop degrades system performance and leads to excessive energy consumption. Minimizing pressure drop requires a systems approach in both design and maintenance. On the supply side, select air treatment components such as aftercoolers, moisture separators, dryers and filters that exhibit the lowest possible pressure drop at specified maximum operating conditions. On the demand side, verify that point-of-use filters, regulators, lubricators, hoses, quick disconnects, hose reels and valves have the proper rating to handle peak flows. Also, pneumatic equipment, supply side and demand side, deserve the recommended best-practices maintenance procedures.
A typical high-speed production machine might contain many fast-acting cylinders. Air cylinders often are the culprits that cause the large point-of-use pressure drops because their flow ratings typically are engineered for consumption during a minute. The real issue is rate of flow when the cylinders are moving. Peak flows could be as much as five to 10 times the published average flow. Because many people size for air consumption per minute, most cylinder control circuits and associated FRLs are undersized and cause high pressure differentials. The following is an example of determining the flow rate into a cylinder.
Beware average flow
The flow rate into a cylinder is based on the amount of air needed to move the piston load at a specified speed and to force exhaust air out of the other side of the cylinder. Because a specific mass of air is required to perform the work, the flow rate can be denominated in terms of standard cubic feet per minute (scfm). A standard cubic foot of air is defined as air at a barometric pressure of 29.92 inches of mercury (we will use 14.5 psia) with a temperature of 68°F and a relative humidity of 0%, and weighs 0.0750 pounds.
The standard flow rate can be calculated by first determining the cylinder volume using:
V = A x S
Where:
V = cylinder volume (cubic inches)
A = the cylinder’s effective internal cross-sectional area (square inches)
S = cylinder stroke (inches)
Next, calculate the compression ratio using:
CR = (Pc + Pa)/Pa
A simplified calculation for Cv is:
Cv = F x A
Where:
F = flow rate (scfm)
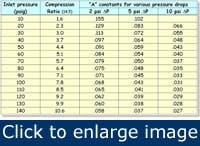
A = correction factor that is a function of inlet pressure and pressure drop and given in the table below.
If the pressure drop across the valve feeding the eight-inch cylinder in the example was 2 psi, its Cv would be:
Cv = F x A
= 363 x 0.075
= 27
Where:
CR = compression ratio (dimensionless)
Pc = pressure at the cylinder (psi)
Pa = ambient pressure (psi)
Finally, calculate the flow rate, using:
F = (V x CR) / (28.8T)
Where:
F = flow rate (scfm)
T = time to fill the cylinder (seconds)
Numerical example
Assume you have an eight-inch cylinder that runs its full eight-foot stroke in three seconds using an air supply of 80 psig.
V = A x S
= ∏D^2/4 x (8 x 12)
= 50.26 in^2 x 96 in.
= 4825.5 in^3
CR = (Pc + Pa)/Pa
= (80 psi + 14.5 psi)/14.5 psi
= 94.5/14.5
= 6.52
F = (V x CR) / (28.8T)
= (4825.5 in^3 x 6.52)/(28.8 x 3)
= 31462/86.4
= 364 scfm
This cylinder requires a flow of 364 scfm at 80 psig if it is to perform as specified. The valves, hoses, filters and regulator for this cylinder should be selected on the basis of this flow rate. Other cylinders on the equipment might be actuating at the same time and their flows must be considered when sizing the branch piping that feeds this machine. Manufacturers typically average the air flow over a one-minute interval, which explains why the published flow data is lower. Installing a dedicated receiver or surge tank at the equipment might help to maintain supply pressure during cylinder activation. The point is you can’t use the average flow as a guideline for sizing components.
Size valves by Cv
When selecting valves for air cylinders, an important consideration is their ability to pass the required volume of air at an acceptable pressure drop. This is referred to as the valve’s flow rating. A common method of rating flow is by means of the flow coefficient (Cv). The Cv derives from an expression that gives the gpm of water that can pass through the valve with a 1-psi pressure drop.
In many valve designs, capacity might vary by as much as 50%. One manufacturer’s ½-inch port valve might pass less flow than another manufacturer’s ¼-inch port valve.
The National Fluid Power Association defines the flow coefficient or Cv as:
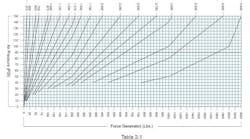
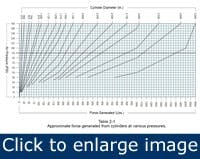
Figure 1. The approximate force a cylinder can exert is a function of inlet pressure and cylinder diameter.
Where:
Cv = flow coefficient
Q = flow (scfm)
G = specific gravity of the fluid
T = absolute temperature (°R)
ΔP = allowable pressure drop (psi)
P2 = outlet pressure (psi)
P1 = inlet pressure (psi)
Pa = ambient pressure (psia)
The effect of relative humidity on the specific gravity of air is 0.6% over the range of 0 to 100% RH and, therefore, can be ignored. The equation is valid only for subsonic flow. To ensure subsonic flow, limit pressure drop so that the value of (P2 + Pa)/(P1 + Pa) falls between 0.85 and 1.00 (see sidebar).
If an individual application requires higher pressure for reasons other than point-of-use restrictions or improperly sized components, it might be best to reengineer the application instead of jacking up the operating pressure for the whole air system. It might be possible to use a cylinder with a larger diameter (see Figure 1), change lever or gear ratios, or install an air amplifier.
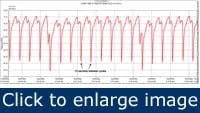
Figure 2. The pressure in a branch line feeding a machine was unable to return to the 81 psi header pressure between machine cycles.
The end of the line
Figure 2 shows a record of the line pressure at the end of the drop where a branch line attached to a machine. Each operating cycle lasts for 12 seconds. The flow required was so great that the line pressure couldn’t even recover to the 81 psi in the header.
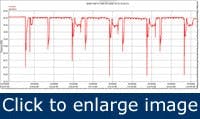
Figure 3 shows a trace from another production machine. The cycles aren’t as fast as in Figure 2, so the pressure rises to the header pressure after each cycle. The FRL is undersized and isn’t passing the needed volume of air per actuation. The results are quite clear in the pressure drops of 20 psig. A good fix is usually a modification of the local piping and FRLs or adding point-of-use storage to compensate for undersized components. It makes good sense to avoid pressure drops at all costs.
Next steps
Figure 3. Less frequent machine cycles allow the pressure in the branch line to return to header pressure, but the FRL has an excessive pressure drop.
You should specify pressure regulators, lubricators, hoses and connections that have the best performance characteristics and the lowest pressure drop. Size these components based upon the actual flow rate (peak flow), not the average flow rate. Couplings, fittings and valves add to the overall pressure drop.
A typical pressure drop across a filter, pressure regulator and hose could be as high as 7 psi, but it could be much higher in poorly designed and maintained systems. When demand-side pressure has been reduced and controlled successfully, turn your attention to the compressor control setpoints to obtain more efficient operation. It might then be possible to unload or shut off a compressor to further reduce energy consumption.
Frank Moskowitz is with DRAW Professional Services, Cave Creek, Ariz. Contact him at [email protected] and (480) 563-0107.
Sources
“Improving Compressed Air System Performance: A Sourcebook for Industry” — a cooperative effort of the U.S. Department of Energy's Office of Energy Efficiency and Renewable Energy (EERE) Best Practices and the "Compressed Air Challenge; CAC Best Practices Manual.” www.compressedairchallange.org
