Mechanical power transmission components usually perform reliably. When a system fails or doesn’t perform properly, it’s usually for one of the following reasons:
- Excessive loading beyond design capabilities.
- Misalignment.
- Inadequate mounting that allows components to move under load, resulting in misalignment.
- Insufficient, improper or contaminated lubrication.
- Unfavorable environmental conditions, such as extreme temperatures or chemical and physical contaminants.
- Improper maintenance procedures, such as forcing belts onto pulleys without first reducing center distance or installing bearings on shafts by pressing on the outer race.
- Defective components.
While the failure analyst must address every item in the above list, this article deals primarily with the first item—loads.
A drive train is a group of components that deliver mechanical power from a prime mover, typically an electric motor, to a load. In most cases, power is available from the prime mover in the form of a rotating shaft. The drive train normally delivers power to the load at lower speed and greater torque than is available directly from the prime mover. To operate successfully, the drive train components must sustain loads without damage or excessive wear.
Component manufacturers
Component manufacturers generally can’t help determine the magnitude of externally applied loads, but they don’t want unhappy users. Therefore, their catalogs often provide a wealth of relevant information, including formulae to calculate loads within the drive train once applied loads are known, and information for evaluating component suitability for an application. If there are problems with components, it would be well worthwhile to read the application information in the catalogs carefully.
Also, manufacturers are typically more than willing to help with specific application questions not addressed in the catalogs.
Load determination
In many applications, it’s difficult to determine loads. Some obvious clues can be obtained from:
- Motor current readings.
- Traditional engineering analysis.
- Comparison with existing systems.
- Assistance from component manufacturers.
- Research in reference books, trade journals, conference proceedings and the Internet.
If these approaches are impractical or otherwise fail to give satisfactory results, it may be useful to measure the loads directly using strain gauges or load cells.
Strain gauges
These small devices detect strain (i.e. “stretch” or “compression”) in the surface on which they are mounted. They are essentially resistors whose resistance changes when stretched or compressed. With a constant excitation current passing through it, the strain gauge is “read” by detecting changes in voltage associated with the change in resistance.
Strain gauges are bonded securely to the surface of the part being investigated. Accurate positioning gives accurate data. Because strain gauges generate small signals—usually 1 to 20 millivolts at full scale—electrical noise can be a problem. It’s possible for the noise level to be greater than signal strength. There are several ways to compensate:
- Install a signal conditioner, which amplifies the signal and filters out noise, as closely as possible to the strain gauge.
- Keep strain gauge leadwires as short as possible because they act like antennas for picking up noise.
- Use conventional shielding techniques, such as steel conduit and shielded, twisted cable.
When applying noise filters, don’t over-filter. If it’s not clear whether an oscilloscope trace is showing noise or signal or both, turn off the gauge excitation to eliminate the signal. Any remaining amplitude must be from electrical noise. When selecting strain gauge instruments, look for a switch that disables excitation current without turning off the amplifier. Not all instruments have this feature.
Temperature changes can induce errors. Temperature effects can be minimized by:
- Using temperature-compensated strain gauges.
- Controlling the temperature of the test area within a narrow range.
- Calibrating and testing at the same temperature.
- Using circuit designs with inherent temperature compensation, such as half and full bridges.
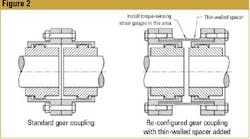
When properly installed and protected, strain gauges can be used in harsh environments, including temperatures from -400 to +500° F, and submerged in oil, water and other liquids. Strain gauges have even been installed in the root fillets of gear teeth (see Figure 1).
Load cells
For our purposes, the term load cell means strain gauge load cell. A strain gauge load cell is a load-sensing device with pre-installed strain gauges. The gauges are arranged to control sensitivity to various kinds of loads. For example, torque-sensing load cells are optimized to detect torque and have no sensitivity to moment (bending), tension or compression. Similarly, tension-compression load cells are optimized to detect tension and compression and have no sensitivity to torque or moment. Users never deal directly with strain gauges in load cells; they simply connect the leadwires to an amplifier.
Special load cells are available in the form of pins, bolts and washers.
Strain gauges versus load cells
The primary advantage of commercial load cells over strain gauges is lower cost. Load cells are typically less difficult and time-consuming to install. While load cells are accurate devices, it can be difficult to place them so they see a load that accurately reflects drive train loads.
The advantage of a strain gauge is a more direct and accurate readings because it can be put directly in the power path. This is particularly advantageous for investigating shocks, where a device not directly in the power path would likely see diminished shock loads.
Because a comfortable service factor is desirable in a drive train, great accuracy is not normally required in determining loads. Because of this and the lower cost of load cells, always consider them first when attempting to measure loads. If severe shocks are suspected, and a load cell arrangement would likely damp out shocks, strain gauges are the better choice.
Routing the signals from rotating strain gauges or load cells to a stationary data logger requires either slip rings or telemetry. Slip rings can introduce noise. Pre-amplifying signals and using high-quality components and multiple brushes minimize noise effects. Slip rings also are limited in speed capability.
Typical slip rings have limiting speeds ranging from 200 to 500 rpm.
Rotary torque sensors
These consist of a shaft with pre-installed strain gauges and a non-contact system to transfer data. The shaft is mounted in a housing with anti-friction bearings. This amounts to a torque-sensing load cell with built-in bearings and telemetry system. Manufacturers of these devices claim ruggedness and noise immunity. Shaft diameters greater than nine inches and torque capacities above 3 million inch-pounds are available. If the application permits, this can be a good way to get load data because the sensing device is directly in the power path.
Device location
Place strain gauges or load cells so the loads they experience accurately represent the loads, including fluctuations and shocks, at the most critical point in the system. This is usually between the point of the most severe loads and the components of the drive that are of concern, and as close as possible to the drive components.
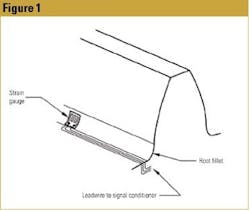
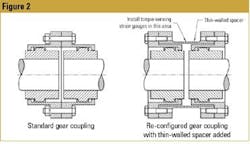
If this is not practical, a good alternative is to measure torque in a nearby component—a coupling, for example. Figure 2 shows a standard gear coupling and the same gear coupling re-configured with an added thin-walled spacer on which strain gauges are installed.
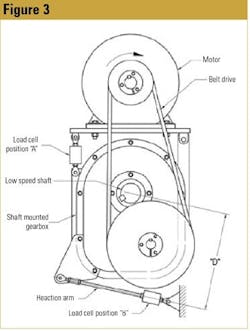
Depending on location, load cells can give fairly accurate indications of the load spectrum, including shocks. Figure 3 shows a shaft-mounted gearbox with two possible positions for load cells. A tension-compression load cell in position A supports some of the motor weight while reacting to the drive belt force. A tension-compression load cell in position B reacts to the torque on the reducer’s low speed shaft. Position B is much better.
In position A, the drive’s mass and the elasticity and friction of the V-belt damp out shocks. In position B, the mass of the entire drive dampens some shocks, but because the gearbox case is so closely coupled to the shock source (the low speed shaft), a load cell provides fairly good indications.
In the drive depicted in Figure 3, the load cell in position A gives much higher readings for clockwise belt drive rotation than for counterclockwise. With clockwise rotation, the load cell is much closer to the belt’s taut span. For counterclockwise rotation, it’s better to have the load cell on the right instead of the left.
If there is uncertainty about the sources of loads, install sensors in several places. Also, it’s often helpful to record data about shaft rotation. For example, one data channel could record a pulse triggered once per revolution of a low-speed shaft. In some applications, it may also be useful to record similar data for other shafts. It may be found that a load cycles at the same frequency as one of the shafts—and this could give a clue as to the source and nature of loads.
Calibration
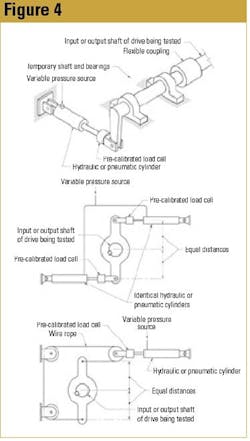
Calibrate sensors before recording data. A typical calibration procedure mechanically locks either the input shaft or the output shaft and applies known loads to the other end of the drive while recording readings for each applied load. It’s important that sensors and drive train components experience the loads in the same manner as when the drive train is operating. This can be awkward in the case of loads that are purely torque. For example, if the gearbox output shaft is coupled to its load with a gear coupling, the load is pure torque. If the sensors are calibrated by applying known loads to the output shaft, the applied calibration loads also should be pure torque. Figure 4 shows three schemes for applying pure torque loads. Keep in mind that the locked drive also applies a load, so the locking method also must represent operational loads accurately.
Shock loads
Shock loads can be difficult to analyze because they rise and fall rapidly, just as noise does. Shocks also can be of such short duration that instruments like voltmeters and ammeters can’t detect them. Noise filtering can inadvertently filter out shock signals. On the other hand, if they are large compared to the noise, the signal can be left unfiltered and the noise ignored. If shocks are suspected, use a fast-responding device, such as an oscilloscope, to monitor data.
The drive train itself can introduce shocks. For example, a gear with a missing or badly damaged tooth generates a shock once per revolution. If the drive is already damaged to the point where it is introducing severe loads on itself, it’s difficult or impossible to get useful information about external loads.
Using the data
Comparing catalog ratings with transmitted loads in existing drives requires knowing torque, speed and power. Operating torque can be obtained by correlating test data with calibration data. Then transmitted power can be calculated using:
P = T*N/63,025
Where: T is shaft torque in in-lbs.
P is power in horsepower.
N is shaft speed in rpm.
Speeds normally can be calculated reasonably accurately using system drive ratios. If significant slip is suspected, measure speed with a tachometer or other device. With the information gained from testing, measures can be taken to either reduce loads or select components better suited to the task. p
Phillips D. Rockwell, P.E., is the owner of Bay Machine Design, a consulting mechanical engineering firm. He can be reached at [email protected] or at 510-528-3698.
