Several years ago, I was engaged to deploy and evaluate a predictive analytics solution at a grain milling facility in the Midwest. Even though the customer was considered a world-class manufacturer, the staff’s mission was to continuously pursue improvements. Unlike with the typical deployment of a predictive analytics solution, however, this customer was not content with traditional use of the technology. The site’s engineers looked well beyond large, rotating equipment. They wanted to monitor a whole slew of “lesser” assets such as heat exchangers, driers, VFDs and the like in an effort to improve plantwide reliability.
The approach applied by most predictive analytics solutions is to analyze historical data and catalogue each asset’s operational states. It’s common practice for these states to be designated as “normal” or “abnormal,” with other descriptors distinguishing the nuances that exist between different states. Straightforward as that may seem, the work involved with cataloging the many operational states and their nuances is not trivial.
It’s not uncommon to take the range of states that an asset experiences for granted (e.g., Product A vs. Product B, 30% load vs. 40% load, startup vs. normal operation, etc.). While predictive analytics technology has proved to provide invaluable advance warning of equipment failure, the investment of time and money is high. Equally important, that investment is ongoing.
Those “lesser” assets are no less important to a plant’s operation. Indeed, in the absence of redundancy, any individual asset’s failure can lead to a costly shutdown, just as the failure of a turbine or other large asset leads to unplanned downtime. Even so, there are applications for which the relationship between cost and benefit no longer holds up under financial scrutiny – as my customer eventually realized. Simply put, vendors of predictive analytics technology don’t target lesser assets because the value proposition tends to falter as either the cost of the asset shrinks or the time to replace it declines.
While many practitioners see the need for predictive analytics, other and simpler approaches have proved equally effective with less complexity and less cost. Consider the following aspects of today’s predictive analytics technology:
Complexity may be an understatement
The machine-learning and data-clustering algorithms generally applied by these advanced prognostics tools have proved effective in assessing the reliability of large rotating equipment. Their track record is less stellar when applied to other production assets. As the production asset becomes more complex and starts to incorporate additional variables, the data analysis becomes exponentially more complicated. When applied to large rotating equipment, the emphasis is limited to vibration data, and it can be easily correlated with temperature, amperage, and a few other measured variables. However, when the technology is applied elsewhere, the data that best depicts an asset’s status is typically far less obvious and adds to the complexity of configuration and support.
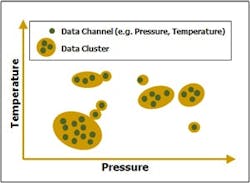
Most predictive analytics technologies rely on data clustering. Clusters from historical process data are designated as either “normal” or “abnormal” and are then used as reference points for ongoing operation of the asset.
To avoid failure…first fail
This is the Catch-22 of most predictive analytics solutions. They rely on clusters of historical data sets as points of reference for each normal and abnormal operational state. In order for the software to detect and eventually prevent failure, it must first know what such a state looks like (i.e. a data cluster from a previous failure). Therefore, historical data must exist from the asset’s most recent catastrophe along with the failures of all other assets that are designated for monitoring. Even with access to such information, the technology is prone to overwhelm users, as any condition that is not matched with an existing “known” state will trigger an alert.
Lots of interpretation required
Many of the techniques that data scientists use in predictive analytics require a significant amount of data analysis knowledge as well as process knowledge. They require a great deal of interpretation that’s generally dependent upon an engineer’s firsthand knowledge of the asset and the conditions under which it operates. The information is then combined with a data scientist's approach to correlating cause-and-effect relationships. If the goal is ultimately to view a simple stoplight chart that depicts asset reliability in terms of Green-Yellow-Red performance, then predictive analytics can get you there…with an abundance of effort and expertise.
Taste the low-hanging fruit
Predictive analytics may have become “the thing” to have, but other technology-based approaches are worthwhile, too – and these often are easier to both implement and maintain. Traditional vibration monitoring and analysis technologies have become the standard for process manufacturers with good reason – they’re more cost-effective and manageable. Even the recent wave of control loop performance monitoring (CLPM) technologies have proved to offer reliable, actionable insights into the performance of key production assets with a limited investment ofknowledge and cost.
With good reason, maintenance and reliability staff are constantly on the watch for ways to improve reliability and increase uptime. The simple fact remains: The cost of downtime to a production facility can be crippling. While predictive analytics offerings have significant merit, they’re not necessarily suitable for all applications. I suspect that will change with time and innovation. Until then, don’t be shy about giving other tried-and-true technologies their chance.
Technologies such as CLPM are easy to deploy, and they equip plant staff with valuable insight into the health of production assets. KPIs such as stiction identify and isolate assets that exhibit negative performance tendencies and that can lead to unplanned downtime.


