Ever wonder why a PID blogger is here on the Plant Services site? One reason: Process control and the PID go hand in hand with maintenance and asset reliability. Allow me to explain.
I’ve toured lots of plants over the years, and I’ve always been struck by the line that usually separates maintenance and reliability staff members from their counterparts on the operations and engineering side. That’s been the case whether I was working at a paper mill, a brewery, a chemical refinery, or even a rendering plant. For sure, there’s a clear distinction in the responsibilities held by the two groups. Whereas one is tasked with preserving the equipment that makes production possible, the other is responsible for maximizing production, which is the plant’s primary objective. Their separation is odd as their goals are identical – to enable a plant to operate safely and profitably.
In the simplest terms, the PID measures, calculates, and responds to error within a production process. On the surface it may seem as though the PID has little to do with a plant’s countless assets. Just beneath the surface, however, the relationship looks far different. PIDs are responsible for automatically driving the mechanical activities that adjust the position of each and every valve or damper located across a plant. That requires work by any number of motors, pumps, and actuators. The PID’s behavior is the source of the very wear and tear that keeps most maintenance staff on edge.
More and more analysis is helping connect the dots and draw maintenance and engineering closer together. Yes, Big Data and Industry 4.0 are converging around the PID controller…along with every other digital device used in manufacturing. To give you a sense of what can be uncovered from PID controller data, the following key performance indicators (KPIs) from a typical control loop performance monitoring (CLPM) solution highlight some hidden insights:
- Mean time before failure - Mean time before failure is an important specification for most reliability engineers as it provides a measure of when a given asset will require maintenance or even replacement. Similarly, output travel provides a measure of valve or damper movement – an indication of how hard the final control element (FCE) is working to regulate control over a process. Higher-than-average movement suggests that the process is responding to a change in upstream behavior and that the associated valve or damper is at rising risk of failure.
A valve operating at its extremes is indicative of a sizing issue which can lead to out-of-spec production.
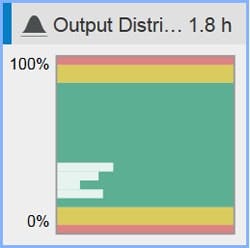
- Off-spec performance - Installing a pump or motor that doesn’t satisfy the application’s specs is sure to lead to plenty of PMs until a replacement is authorized. Output distribution provides similar insights, as it analyzes how much time an FCE spends across its full range of movement. Ideally an FCE such as a valve will spend 80% of its time near the middle of its range. One that spends the majority of its time near either the fully closed or fully open position is sized incorrectly and is in need of replacement.
- Overall equipment effectiveness (OEE) - OEE is commonly referenced as a measure of manufacturing efficiency – an OEE value that dips suggests issues with the means of production. So, too, the average absolute error (AAE) quantifies the amount of variability or error associated with a given PID control loop. When AAE increases it signals that the process is responding to dynamic behavior that could have a material, negative effect on process equipment and ultimately lead to unplanned downtime.
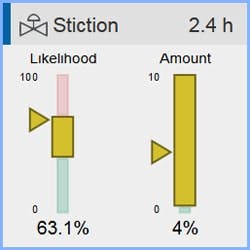
Control loop data offers insights into the probability and amount of Stiction that may affect a given asset.
- Erratic behavior - Whether due to age, use, or both, equipment that operates inconsistently presents a problem and demands attention from maintenance. Stiction is a common condition that hampers the performance of valves and dampers, and it requires corrective action by engineering. Known as “sticky friction,” it prevents an FCE from moving freely in response to a PID controller’s prompts. By restricting the FCE, it undermines control and puts a plant’s production at risk.
What I hope this post makes clear is the close relationship existing between a plant’s PIDs and its many assets. And while we've addressed a few CLPM metrics that make the connection, there are other KPIs that strengthen the argument. In my last post, I shared how AAE and an oscillation KPI extended the life of one manufacturer’s assets by more than 50%. Ultimately the analysis of PID data using plantwide process diagnostic tools is not only beneficial to technicians and engineers, but also it equips practitioners from maintenance and reliability with equally helpful insights.


