This is the third and final article discussing the 2021 Alidade MER/Plant Services Magazine Leadership Survey. In this article, I’ll explain the method used to generate motivation scores and how motivation scores can be used for groups and individuals. When people are motivated they perform at higher levels, benefiting themselves, their leaders and their organizations.
The method used to generate a motivation score is a technique known as Expectancy Theory. This theory was developed by Edward Tolman and research was continued by Victor Vroom and published in his book Work and Motivation. The theory is based on the idea that a person will choose their behaviors based on what they believe will lead to the most beneficial outcomes.
There are three elements to Expectancy Theory; expectancy, instrumentality and valance.
- Expectancy is the belief that higher or increased effort will yield better performance; your confidence that if you put in the effort required, you will reach your goal.
- Instrumentality is the belief that if an individual performs well, then a valued outcome will be achieved; how confident you are that achieving a goal will lead to the outcome.
- Valance means “value” and refers to beliefs about an outcome’s desirability; how much you really want the outcome.
Outcomes can be a pay increase, promotion, respect from co-workers, recognition or awards or even just a sense of accomplishment. In the case of the 2021 Leadership Survey, we used eleven different instrumentality and valance statements in pairs. For example, “you will get a bonus or pay raise if you perform your job exceptionally well” and “getting a bonus or pay raise is important to me”.
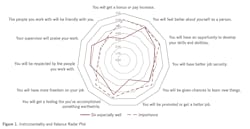
When each of the instrumentality and valance pairs are graphed on a radar plot (Figure 1) you can clearly see mismatches. In the example of getting a bonus or pay raise (shown at the 12 o’clock position), a pay raise is important (dashed line). But the feeling is, even if they work hard and perform exceptionally well, they don’t expect to get a bonus or pay raise (solid line).
Industrial training is a process, not a one-time stop
Can you see how demotivating it can be? How hard it can be to motivate a team member when they don’t believe extra effort will result in a positive outcome?
Let’s say you are a supervisor, and the responses in Figure 1 are from your direct reports. You probably can’t provide bonuses or pay raises under your authority. However, you can get to know your team members. Study your company policies on bonuses and pay raises. Figure out how your team or individuals can put themselves in position for bonuses or pay raises. Then, work to arrange training, experiences, and opportunities for people. Enable them to demonstrate performance that can increase their opportunities for bonuses or pay raises. The same applies to each of the other instrumentality and valance pairs.
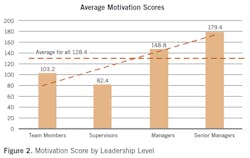
Some general findings from the leadership survey were that the differences between instrumentality and valance trended to be less with increasing levels of leadership. Supervisors had smaller gaps than team members. Managers had smaller gaps than supervisors. Senior managers had smaller gaps than managers. In addition, the instrumentality and valance scores trended higher, resulting in a higher motivation score trend with higher seniority (Figure 2).
The average motivation scores for all respondents in 2021 was 128, compared with 147 in the 2015 survey. That’s a 13% reduction in overall motivation; could it be COVID fatigue?
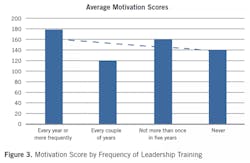
Another interesting trend that agreed with the data from the 2015 survey is the amount of leadership training received by leaders (Figure 3). As training frequency decreased, a leader’s motivation scores also decreased.
Supervisor respondents indicated that supervisors were in their positions, on average, about 10 years. They reported having no leadership training prior to becoming a supervisor. On average after assuming a leadership position, those supervisors had only received 50 hours of total leadership training. That means over 10 years of being in leadership positions, the average supervisor got five hours of leadership training per year.
Summarizing the leadership survey, organizations that embrace productive leadership can make tremendous improvements in team effectiveness and motivation. The costs include getting productive leadership training, the time it takes to understand team members valance items, the time spent coaching, and the cost of supporting motivating activities. The benefits are typically things like increased productivity, reduced employee turnover, reduced absenteeism and grievances.
In Chapter 1 of my book The Productive Leadership System, I provide an economic analysis of these costs and benefits. In the first year, to year and a half of getting productive leadership in place, there are about $5.5 of benefit for every $1 invested. Sustaining a productive leadership system will result in $47 dollars of return for every $1 invested. As with the previous article on team effectiveness, a complete explanation of how to use Expectancy Theory is provided in Appendix C of my book. Go forth and do great things.
This story originally appeared in the December 2021 issue of Plant Services. Subscribe to Plant Services here.
This article is part of our monthly Human Capital column. Read more from Tom Moriarty.
About the Author
Tom Moriarty
P.E., CMRP, President of Alidade MER, Inc.
Tom Moriarty, P.E., CMRP is president of Alidade MER, Inc., a consulting firm specializing in asset management, reliability engineering, and leadership improvement. He is a member of SMRP (Florida Chapter Board Member and CED Director), a past Chair of ASME’s Canaveral Florida Section, and author of the book “The Productive Leadership System; Maximizing Organizational Reliability”. He has a BSME, an MBA (organizational development), is a licensed professional engineer (PE) in Florida, and a Certified Maintenance and Reliability Professional (CMRP). Contact him at [email protected], (321) 773-3356, or via LinkedIn at www.linkedin.com/in/alidade-mer.


