Mean time between failure (MTBF)1, is one of the most widely used metrics in physical asset management. Generally, companies use it as a guide to evaluate the performance of their physical assets, helping them identify assets or processes that are causing lost revenue and other cost-related issues.
Although widely applied, MTBF is still the subject of some confusion. MTBF is useful for a range of different purposes, giving organizations greater ability to increase the net present value of their physical asset base.
When companies first look at implementing MTBF, they tend to ask three fundamental questions:
- What can MTBF tell us about our assets
- What levels can it be applied at
- How can MTBF be used to add value to our reliability initiatives
What MTBF can tell us
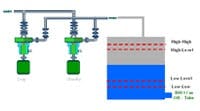
Figure 1. Example system
The standard use of MTBF in industry is to tell us the performance of the primary function of an asset or system.
For example, a pumping system consists of a duty/standby pump arrangement, a pressure relief valve, piping, a tank and associated level switches. The primary function of this system is to pump water to tank B at a rate of between 900 liters/minute and 1,000 liters/minute. In this case, a failure occurs when the pump system is unable to pump water at the required rate for whatever reason.
Here, we can calculate the MTBF as follows:
So, if the total time required to deliver this function was five years and there were four failures in that time, the average time between failures would be 5/4 = 1.25.
If this were the mean time between failures, then the failure rate for one year would be 1/MTBF or 1/1.25, which is 0.8, or 80% likelihood of experiencing a failure of the primary function in one year.
If we then wanted to convert this into months, we would first convert the MTBF figure to months, 1.25 years = 15 months, then again determine the likelihood of this occurring in one month: 1/15, or 0.066.
This means there is a 6% likelihood of experiencing a failure resulting in the loss of the primary function in any given month. We could do the same for a week, a day or any other given period.
The above example shows us that initial uses of MTBF can provide us with the average time between failures2 for a given time period, and that this can then be manipulated to give us a failure rate3 for any specified period of time.
Thus, for one measurement of MTBF, we are able to calculate the following information:
MTBF of the primary function = 1.25- Likelihood of a failure in one year = 1/1.25years (80% or 8 x 10⁻¹)
- Likelihood of a failure in one month = 1/15 months (6% or 6 x 10⁻²)
- Likelihood of a failure in one day = 1/456.25 days (0.22% or 2.2 x 10⁻³)
- Likelihood of failure in one hour = 1/10,950 hours (0.009% or 9 x 10⁻⁵)
The formula takes into account the total time of the function, not of the asset itself. This means that regardless of the number or type of assets in the system, the calculation always uses the total time required of the function, or five years in this example.
At what level can we apply MTBF?
Like many other metrics in physical asset management, MTBF is applicable at any level throughout the asset base.
For performance measurement, there are two rules for its application:
- It is always used to measure the function of the asset where it is being applied.
- It always uses the total time required of the function of the level where it is applied.
In the example given above, we determined that the MTBF for the pumping system was 1.25 years, and we were then able to derive failure rates for various other periods.
In addition, we can also apply this to the assets in the system as demonstrated in table 1.
| Asset | Function | Total Time Required | Number of Failures | MTBF | Annual Failure Rate |
| Duty Pump | To pump water to tank B at a rate of between 900 l/minute and 1,000 l/minute | 5 years | 7 | 0.714 years | 140% |
| Stand By Pump | To maintain 800 l/minute to 1,000 l/minute if the duty pump fails | 5 years | 2 | 2.5 years | 40% |
| Piping | To provide clear access for 800 l/minute to 1,000 l/minute from the pump sets to the tank | 5 years | 1 | 5 years | 20% |
| High-High Level Switch | To trip the pumping system when water reaches the high-high level | 5 years | 1 | 5 years | 20% |
| High Level Switch | To shut off the pump when the tank level reaches the high level | 5 years | 1 | 5 years | 20% |
| Low Level Switch | To turn on the pump when the tank has been drained to the low level | 5 years | 1 | 5 years | 20% |
| Low-Low level switch | To alarm when the tank level has been drained to the low-low level | 5 years | 0 | 5 years | 20% |
| Tank | To contain up to 250,000 liters of water | 5 years | 0 | 5 years | 20% |
| Pumping System | To pump water to tank B at a rate of between 900 l/minute and 1000 l/minute | 5 years | 4 | 1.25 years | 80% |
Table 1 contains some information that should immediately provoke some questions. For example, we have counted four failures in our system level MTBF, yet the table contains 13 failures. (Not counting the system failures.)
To understand this we need to review the functions for each of the components mentioned.
The function of the high-high level switch is to trip the pumping system when water reaches the high-high level. If there is a failure preventing this asset from performing its function, it will not prevent the system from pumping water. We have had one failure on the switch that we know about in this period.
Another obvious issue is the fact that we have had seven failures of the duty pump. During this time, we have also had two failures on the standby pump, a dormant function, which we know of. Because this system has redundancy built into it, we can only experience a loss of the primary function if we have a failure of the duty pump and the standby pump at the same time.
The four failures causing the loss of function at the system level were:
- One multiple failure of the duty and standby pump
- One failure of the high level switch, meaning the level reached the high-high level once during the five-year period
- One failure of the low-level switch, resulting in the low-low level tripping the downstream process
- One failure of the piping causing downtime
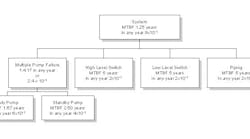
Figure 2 - MTBF at Different Levels
All the other failures mentioned were either hidden to the operations team until revealed by inspection, or their function was protected by other assets (as in the case of the failures on the duty pump).
As shown in Figure 2, MTBF is useful at any level throughout an asset base. However, its application must be on the functions of the assets and the total time required of each function, at each level of performance measurement.
How can MTBF add value to reliability initiatives?
In the hands of a skilled RCM facilitator, the measurement and manipulation of MTBF can be used to set the performance expectations of the physical asset base, as well as providing a base for evaluation of strategies and indicating the overall performance of assets; not just the performance of their functions.
This helps organizations in the change process because they begin to think about what the assets do, rather than what they are. That is, an appreciation of functional performance as opposed to asset performance.
For example, in the system described in Figure 1, we can break the system down into its functions and begin to assign performance expectations to each of these4.
Function 1: To pump water to tank B at a rate of between 900 l/minute and 1,000 l/minute
Functional Failure 1.A: Does not pump water at all
The water pump in this example provides the cooling water for a petrochemical plant. If the system is unable to pump water, there will be a loss of production. The tank contains enough water to keep the plant running for a minimum of two hours and a maximum of six hours.
A multiple failure of both pumps would nominally result in a loss of production equal to $2 million. In this case, the asset owner would like to keep the likelihood of this occurring to a reasonably low level, and he decides on a level of 1:10,000 years, or an annual rate of 10-4.
This means management of all failure modes causing this consequence, an adverse impact on operational capability, to the same level of likelihood.
Function 2: To trip the pumping system when water reaches the high-high level.
Functional Failure 2.A: Does not trip when the water reaches the high-high level.
In the case of the water system, an overflow of the tank would result in water in the surrounding area. This is a slip hazard for employees sent to correct the issue, but the asset owner does not regard it as a serious hazard, nor will it result in any damage to additional equipment.
The failure mode is dormant, meaning it will only have consequences when there is a failure of the high-level switch and the high-high level switch. In this particular case, the asset owner is at ease accepting a higher level of risk of occurrence, say, one in every 100 years, or a likelihood of 10-2 in any one year.
Function 3: To alarm when the tank level is at the low-low level.
Functional Failure 3.A: Does not trip when the tank is at the low-low level.
As with the high-high protection, this alarm is only required once there has already been a failure of some sort, notably a failure of the low-level switch.
If this were to occur and the tank consequently ran dry, the results would be catastrophic in financial terms. The down-stream equipment would run dry and the plant would be without cooling water, forcing a loss of production estimated at around three days, or $6,000,000. There also would be damages conservatively estimated at $1.5 million for producing assets.
The asset owner sees this as the worst possible outcome of a failure of this system. As a result, he would like to keep the likelihood of failure at 1:100,000 years, or 10-5 per year. The resulting performance expectations of failure modes are in Table 2 below.
The sum of each of the failure modes contributing to the loss of function must equal the desired failure rate or risk at the above level (assuming these are all the relevant failure modes).
| Function | Failure | Desired Failure Rate | Existing Annual Failure Rate |
| To pump water to tank B at a rate of between 900 l/minute and 1,000 l/minute | Desired failure rate is 10-4, therefore, every failure mode underneath must be managed to at least 4x10⁻⁵ to ensure this level is reached. | ||
| Multiple Pump Failure | 4x10⁻⁵ | 1:1.67 x 1:2.5 = 1:4.17 or 2.4x10⁻¹ |
|
| Piping | 4x10⁻⁵ | 1:5 | |
| High-Level Switch | 4x10⁻⁵ | 1:5 | |
| Low-Level Switch | 4x10⁻⁵ | 1:5 | |
| To trip the pumping sys-tem when water reaches the high-high level | High-High Level Switch | 1:10-2 | 1:5 x 1:5 = 1:10 |
| To alarm when the tank level has been drained to the low-low level | Low-Low level switch | 1:10-5 | 1:5 x 1:5 = 1:10 |
Here we can see the desired failure rates set out in Table 2 for each function and translated into a performance requirement for each failure mode.
Note that the failure of the low-low level switch, even though it is the worst-case scenario, has a per-formance standard lower than the failures leading to the loss of the primary function. Paradoxically, the primary function is managed to a lower level than the loss of the low-low level switch.
This is due to the multiplying effect when calculating performance in this way. Each failure mode leading to the loss of the function needs to be managed to a level that, when summed together, is equal to the performance standard of the function.
We can also record actual MTBF measures against this to see how effective we have been in managing the failures of this asset to the desired levels of performance. However, this would only be a guide. The MTBF measured would only calculate since the beginning of measurement. The best use of this approach is to provide valuable input for RCM analysts, as well as for other applications within the reliability field. It would also give asset owners a predetermined risk envelope that they require their assets to work within, increasing their control over asset performance, and hence, over corporate profitability.
MTBF is an exceptionally useful metric in the field of physical asset management and it is possible to apply it at any level throughout the physical asset base.
The principal benefit of wide-ranging use of MTBF is that it begins the process of focusing a company on how the assets work to fulfill a function, rather than what those assets actually are. This is one of the fundamental concepts of reliability-centered maintenance.
At whatever level it is applied, MTBF measures the function performed by the asset, the asset system, or the entire process. It also is useful for proactively establishing the performance expectations of the asset base, particularly in the areas of the efficiency function.
E-mail Daryl Mather at [email protected].
Footnotes
1 This module deals with MTBF in isolation and does not discuss other metrics such as Mean Time To Failure (MTTF) or Mean Time To Repair (MTTR).
2 Total time required ⁄ number of failures
3 1 ⁄ MTBF
4 Full details about how to construct a risk profile based on performance expectations is contained in Section 6, Managing asset data


